After a strong rebound in April, which saw deal activity hit a 12-month high of 134 transactions, May 2025 witnessed a sharp pullback with only 99 funding deals in the Indian private markets, returning to the same volume last seen in February this year.
Despite this, funding value remained robust, crossing ₹11,000 crore, showcasing that larger cheques continue to be written even as overall deal count dipped.
Deal Value Holds Steady
Indian private companies collectively raised ₹11,154 crore in May 2025 – a slight drop from April’s ₹13,827 crore but still significantly higher than most months in the last year. The strong funding levels, despite lower deal activity, indicate continued investor conviction in high-potential opportunities.
| Month | Amount Raised (₹ Cr) |
| May 2025 | ₹11,154 |
| Apr 2025 | ₹13,827 |
| Mar 2025 | ₹9,916 |
| Feb 2025 | ₹10,330 |
| Jan 2025 | ₹9,482 |
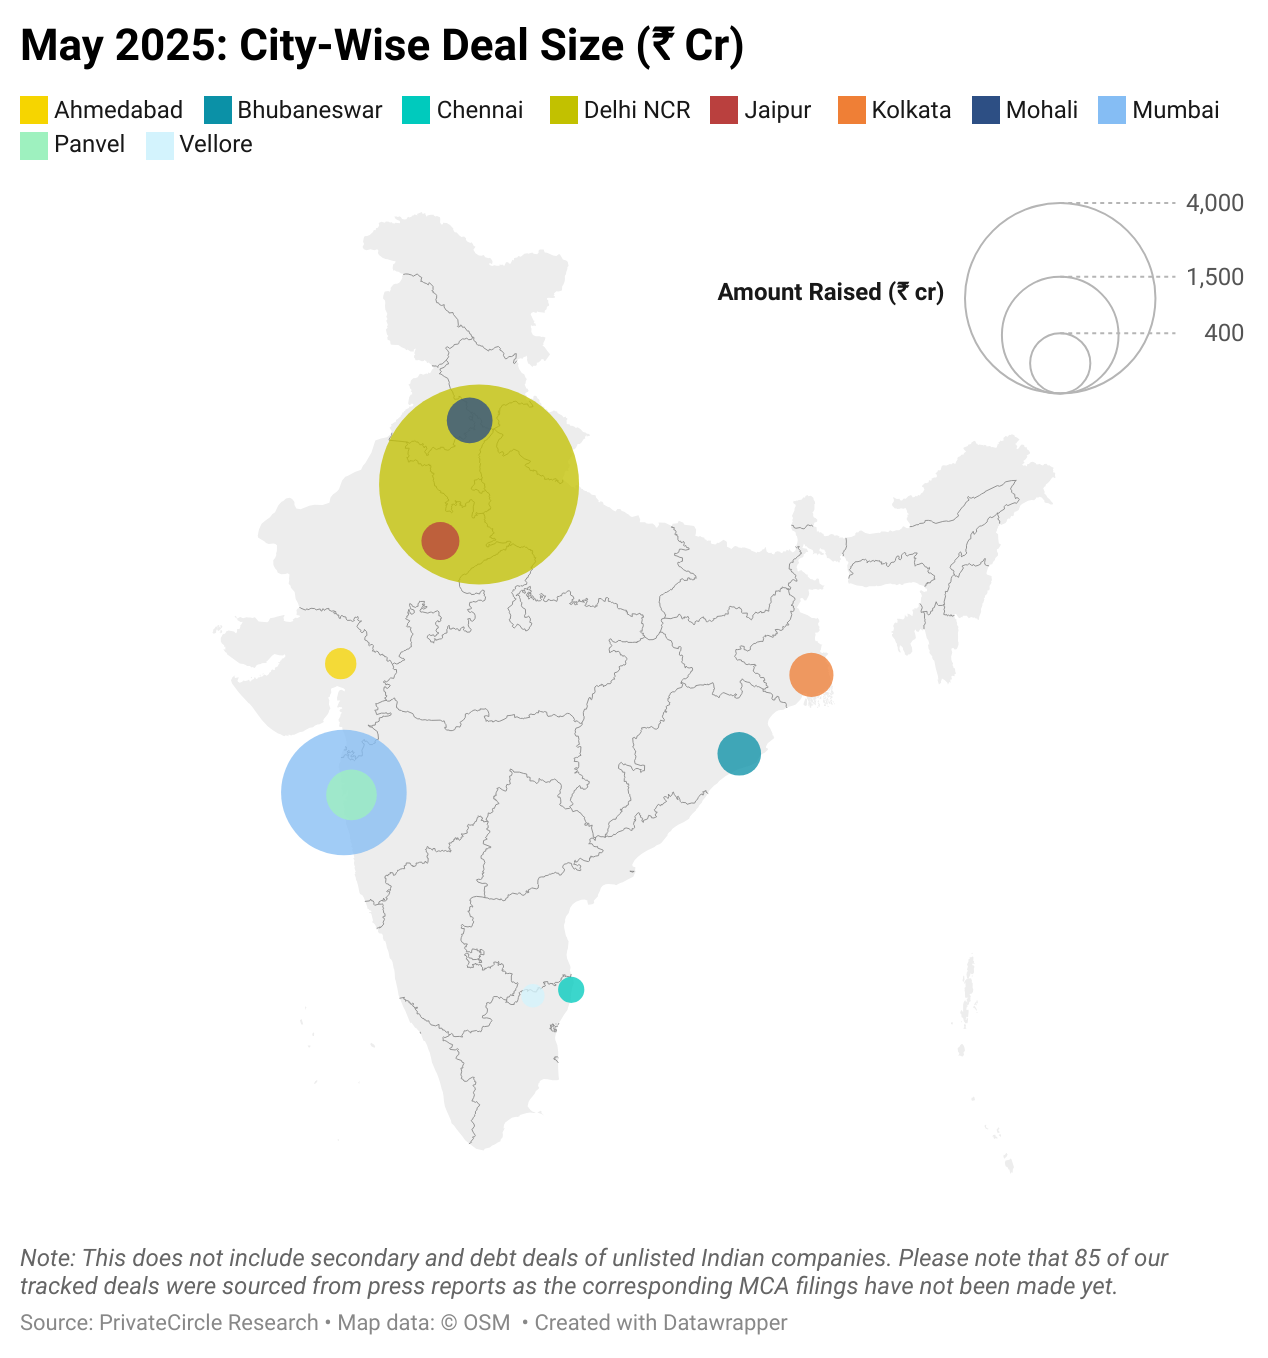
City-wise Breakdown: Metro Dominance Strengthens
Tier 1 cities completely dominated the funding landscape in May:
- Tier 1 cities raised a whopping ₹10,258 crore across 88 deals, accounting for over 90% of the total funding.
- Tier 2 & 3 cities contributed only ₹883 crore from 11 deals, showing a stark urban-rural capital divide.
| City Tier | Amount Raised (₹ Cr) | Deal Count | Avg Deal Size (₹ Cr) |
| Tier 1 | ₹10,258 | 88 | ₹116 |
| Tier 2 & 3 | ₹883 | 11 | ₹80 |
Top cities by amount raised:
- Delhi NCR – ₹4,411 Cr across 37 deals
- Mumbai – ₹1,698 Cr across 18 deals
- Panvel – ₹250 Cr (1 deal)
- Mohali – ₹200 Cr (1 deal)
- Kolkata – ₹185 Cr (3 deals)
- Bhubaneswar – ₹180 Cr (1 deal)
- Jaipur – ₹133 Cr (3 deals)
- Ahmedabad – ₹86 Cr (2 deals)
- Chennai – ₹57 Cr (4 deals)
- Vellore – ₹43 Cr (1 deal)
Investor Activity by City Tier
Tier 1 cities not only attracted the highest amount of capital but also dominated participation across investor classes:
| Investor Type | Tier 1 Deals | Tier 2 & 3 Deals |
| Angel Investors | 22 | 2 |
| Family Offices | 9 | 0 |
| VC/PE Firms | 46 | 7 |
Metro cities continue to be the stronghold of institutional capital and late-stage rounds, while smaller cities remain limited to selective early-stage deals.
Top 3 Deals of the Month
- PB Healthcare Services – ₹1,867 Cr
- Porter (logistics) – ₹1,713 Cr
- Myntra (fashion ecommerce) – ₹1,067 Cr
These top three accounted for a significant portion of total deal value, highlighting the preference for scaled-up platforms in logistics, fashion, and healthcare.
Deal Volume Trends
Fewer Deals, Bigger Cheques
While the number of deals dropped to 99, capital inflow remained resilient – indicating selective but substantial bets by investors.
| Month | Deal Count |
| May 2024 | 100 |
| Jun 2024 | 111 |
| Jul 2024 | 99 |
| Aug 2024 | 121 |
| Sep 2024 | 107 |
| Oct 2024 | 108 |
| Nov 2024 | 93 |
| Dec 2024 | 142 |
| Jan 2025 | 141 |
| Feb 2025 | 99 |
| Mar 2025 | 113 |
| Apr 2025 | 134 |
| May 2025 | 99 |
Top Investors by Deal Volume
- British International Investment – 4 deals
- Lightspeed India Partners – 4 deals
- Arkam Ventures – 3 deals
- Inflection Point Ventures – 3 deals
- We Founder Circle – 3 deals
The consistency from these investors, particularly across early and growth stages, shows ongoing commitment to Indian private markets despite global macro uncertainties.
Investor Type Breakdown
VC/PEs Still in Control, Angels Step Back
Venture and private equity firms continue to lead the funding charge, while angel activity cooled and family offices remained steady.
| Investor Type | May 2025 | Apr 2025 | Mar 2025 | Feb 2025 | Jan 2025 |
| VC/PE Firms | 58 | 80 | 76 | 51 | 100 |
| Angel Investors | 24 | 32 | 24 | 29 | 36 |
| Family Offices | 9 | 7 | 6 | 5 | 12 |
Final Takeaways
- May funding value held strong at ₹11,154 Cr despite a dip in deal count
- Tier 1 cities captured 90%+ of funding and investor activity
- Delhi NCR and Mumbai continue to lead; non-metros remain marginal
- Top investors stayed consistent, betting on mature businesses
- Mega-deals in healthcare, logistics, and fashion drove funding momentum
India’s private markets are maturing fast. The story isn’t just about who raised – it’s about who survived, who scaled, and who still draws capital when the bar for capital is higher than ever.
Stay ahead in this evolving landscape – subscribe to our newsletter and follow PrivateCircle for in-depth insights and updates on the growth and resilience of India’s private markets.