The Indian startup ecosystem continues to show diverse patterns in its funding landscape.
November 2024 witnessed notable changes, with city-wise funding figures revealing important shifts in regional funding dynamics. While Tier 1 cities continue to dominate, there was a significant decrease in funding amounts in both Tier 1 and Tier 2 & 3 cities compared to the previous months.
The total funding raised across cities amounted to a noteworthy ₹4,790 crore, a stark contrast to the vibrant ₹6,205 crore raised in October and the record ₹11,459 crore in September.
Key Highlights:
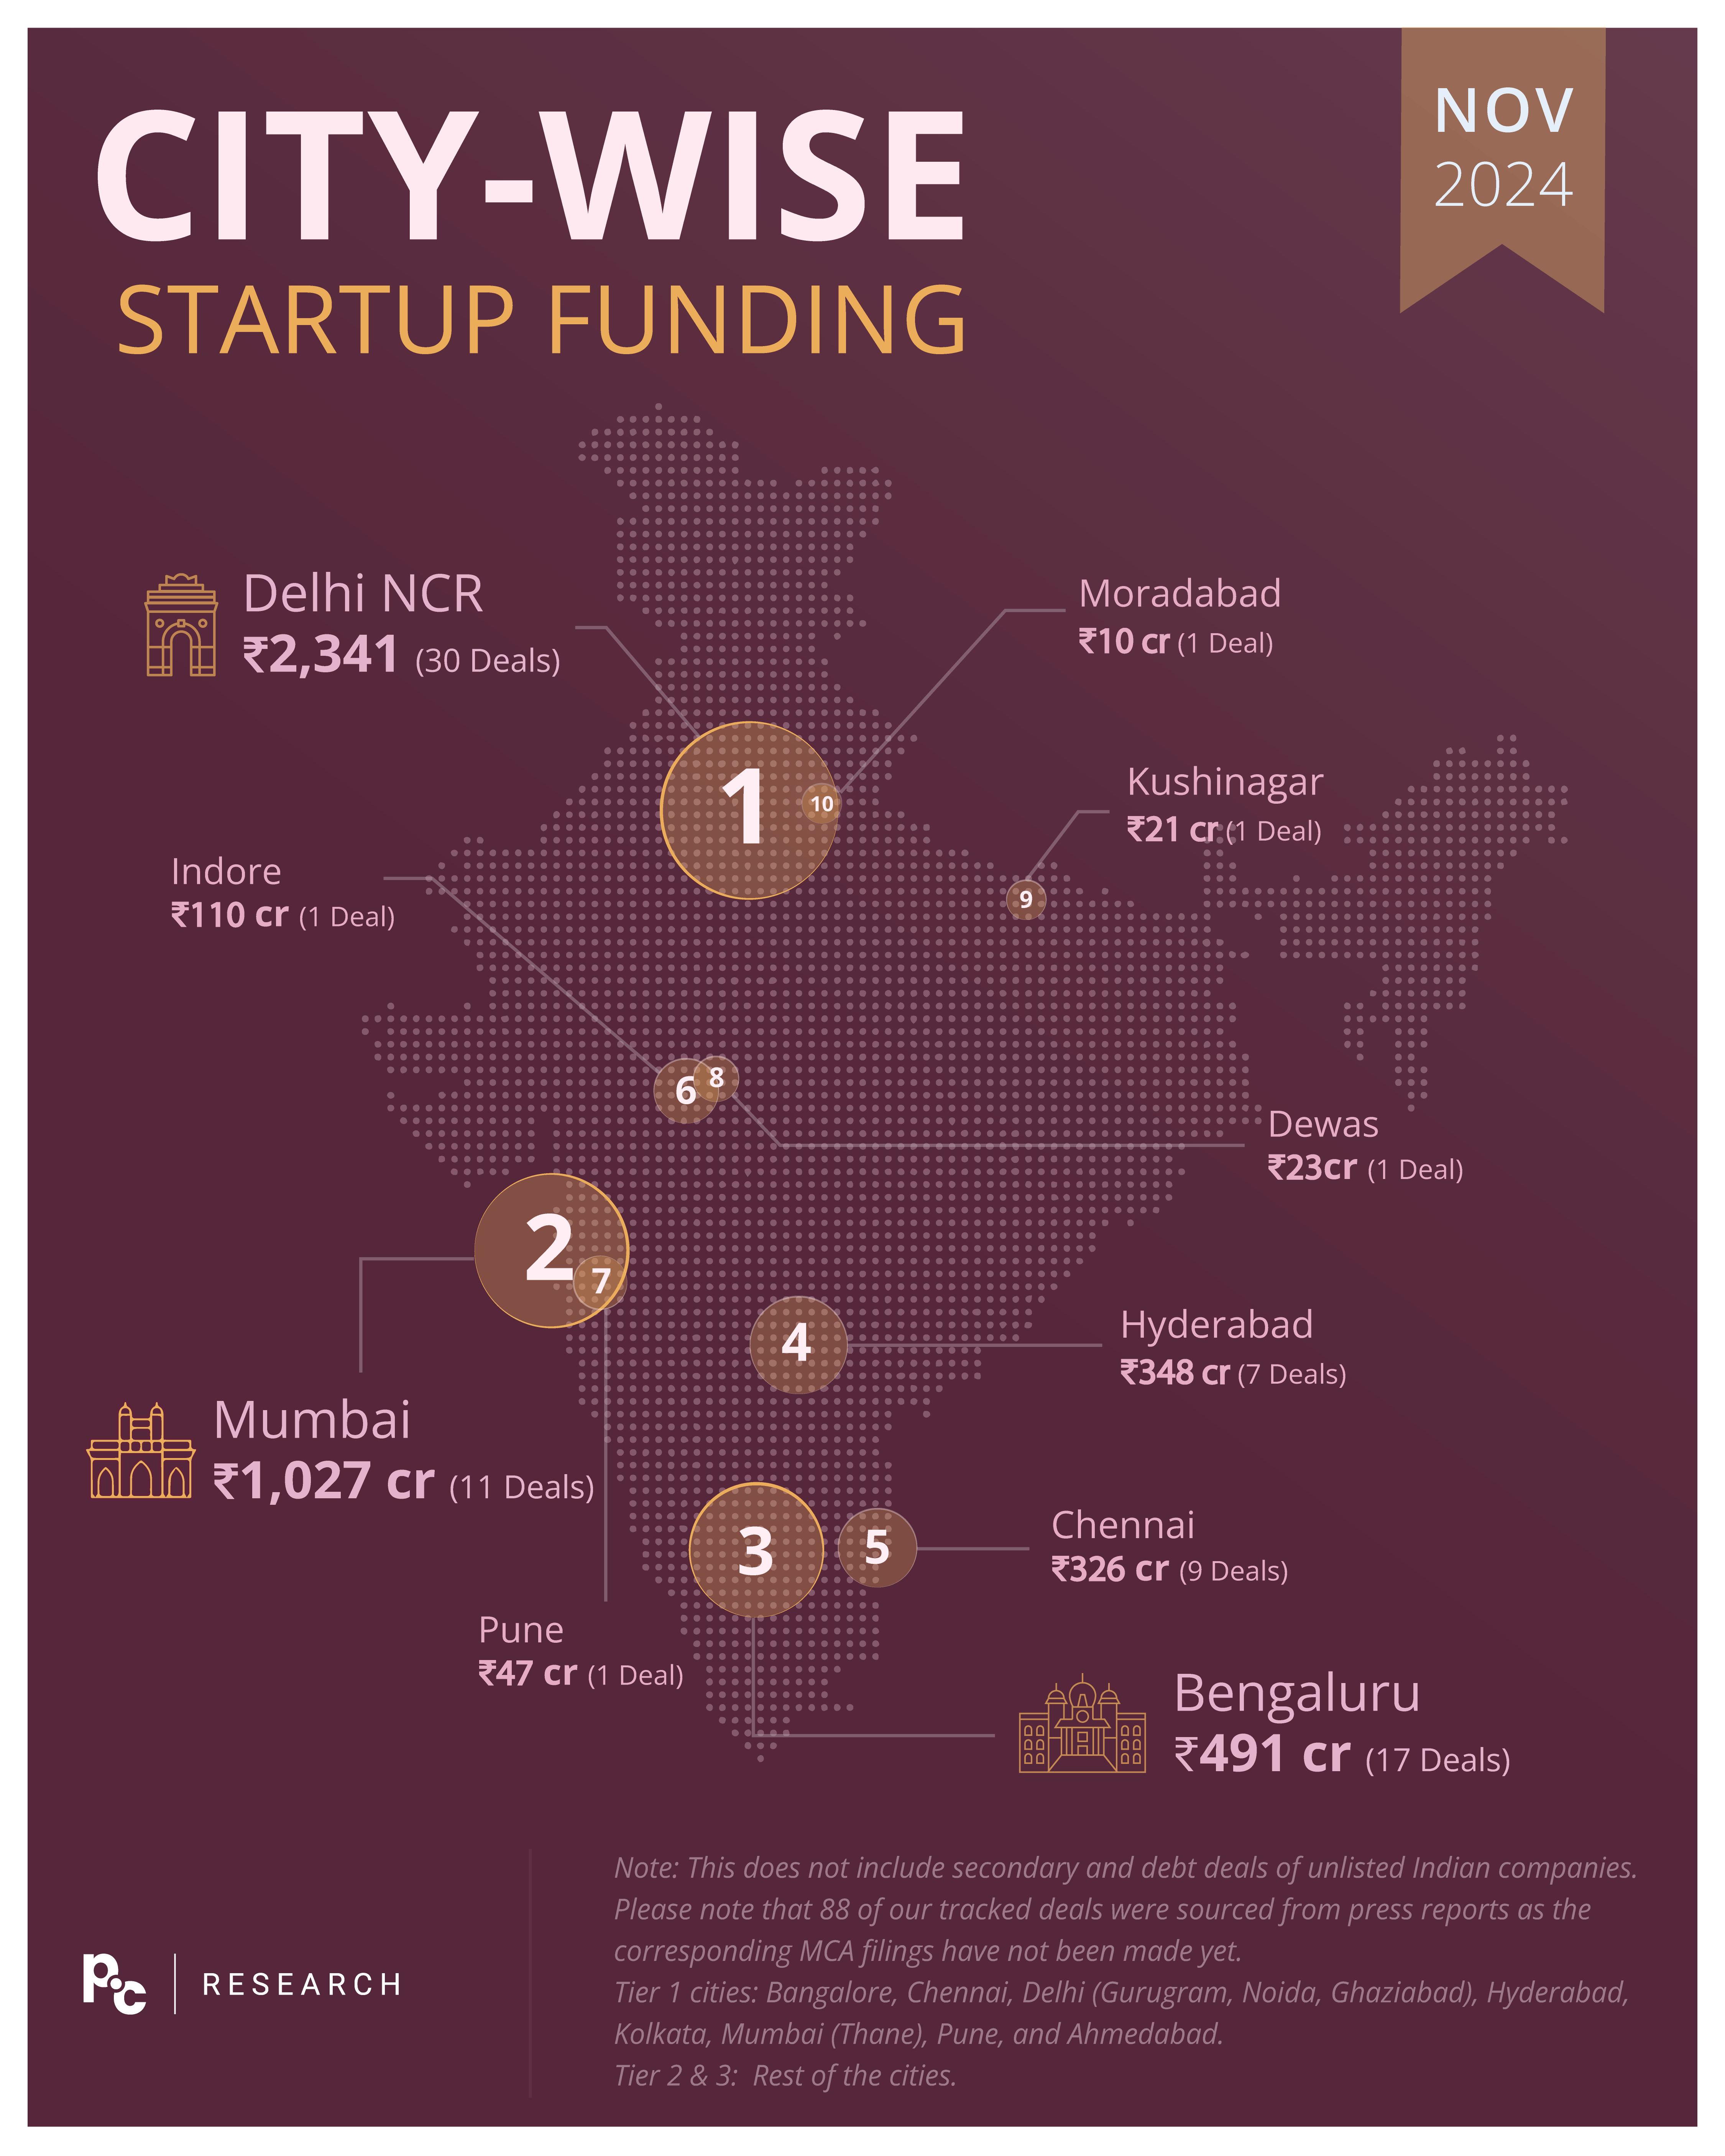
- Delhi NCR led the pack with an impressive ₹2,341 crore raised across 30 deals.
- Tier 1 raised a combined ₹4,588 cr, down from last month’s ₹6,205 crore. Tier 2 raised a combined ₹202 cr, sharp decline from last month’s ₹1743 cr.
- Yet again VC/PE dominated with 61 deals across the tiers, followed by Angel Investors and Family Offices at 19 and 5 deals respectively across the tiers.
Blog Outline: Data and Insights by PrivateCircle Research
- Deal Numbers & Size
- Funding Across Tier 1, 2 & 3 Cities (₹ Cr)
- Avg. Deal Size for Tier 1-3 City Startups (₹ Cr)
- Investor Type by City Tier
- Job Creation & Economic Impact
- Comparative Analysis
- Conclusion
Deal Numbers & Size
In November, Delhi NCR dominated the funding landscape, raising ₹2,341 crore across 30 deals, followed by Mumbai with ₹1,027 crore over 11 deals. Bengaluru secured third place with ₹491 crore raised across 17 deals.
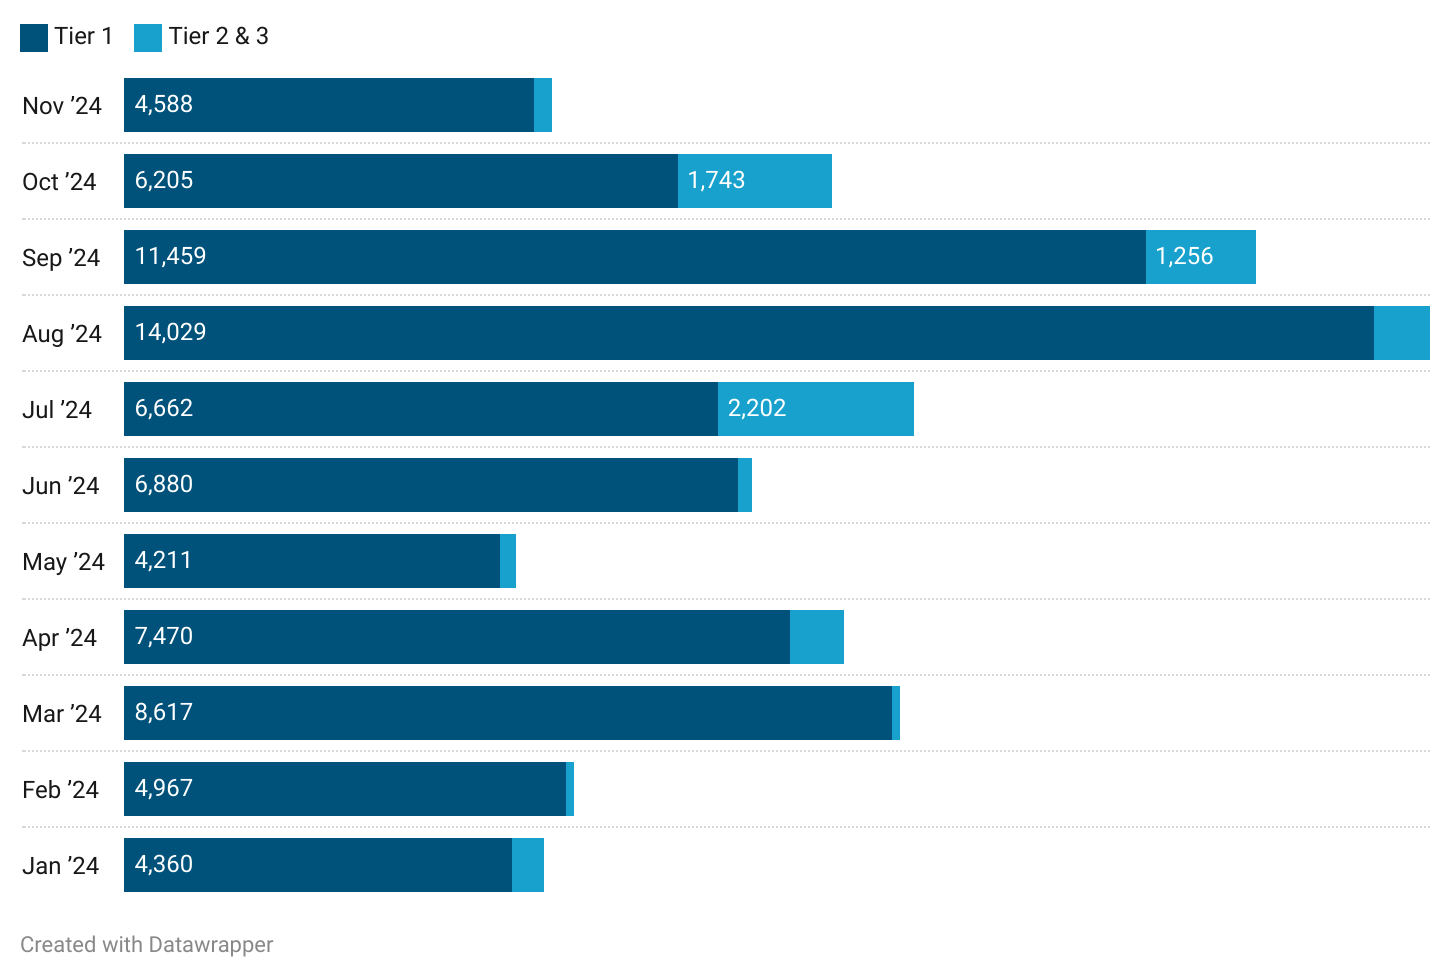
Funding Across Tier 1, 2 & 3 Cities (₹ Cr)
Tier 1 cities raised ₹4,588 crore, continuing a downward trend from ₹6,205 crore in October. Similarly, Tier 2 & 3 cities also experienced a dip in funding, securing just ₹202 crore compared to ₹1,743 crore in October.
Note: This does not include secondary and debt deals of unlisted Indian companies. Please note that 88 of our tracked deals were sourced from press reports as the corresponding MCA filings have not been made yet.
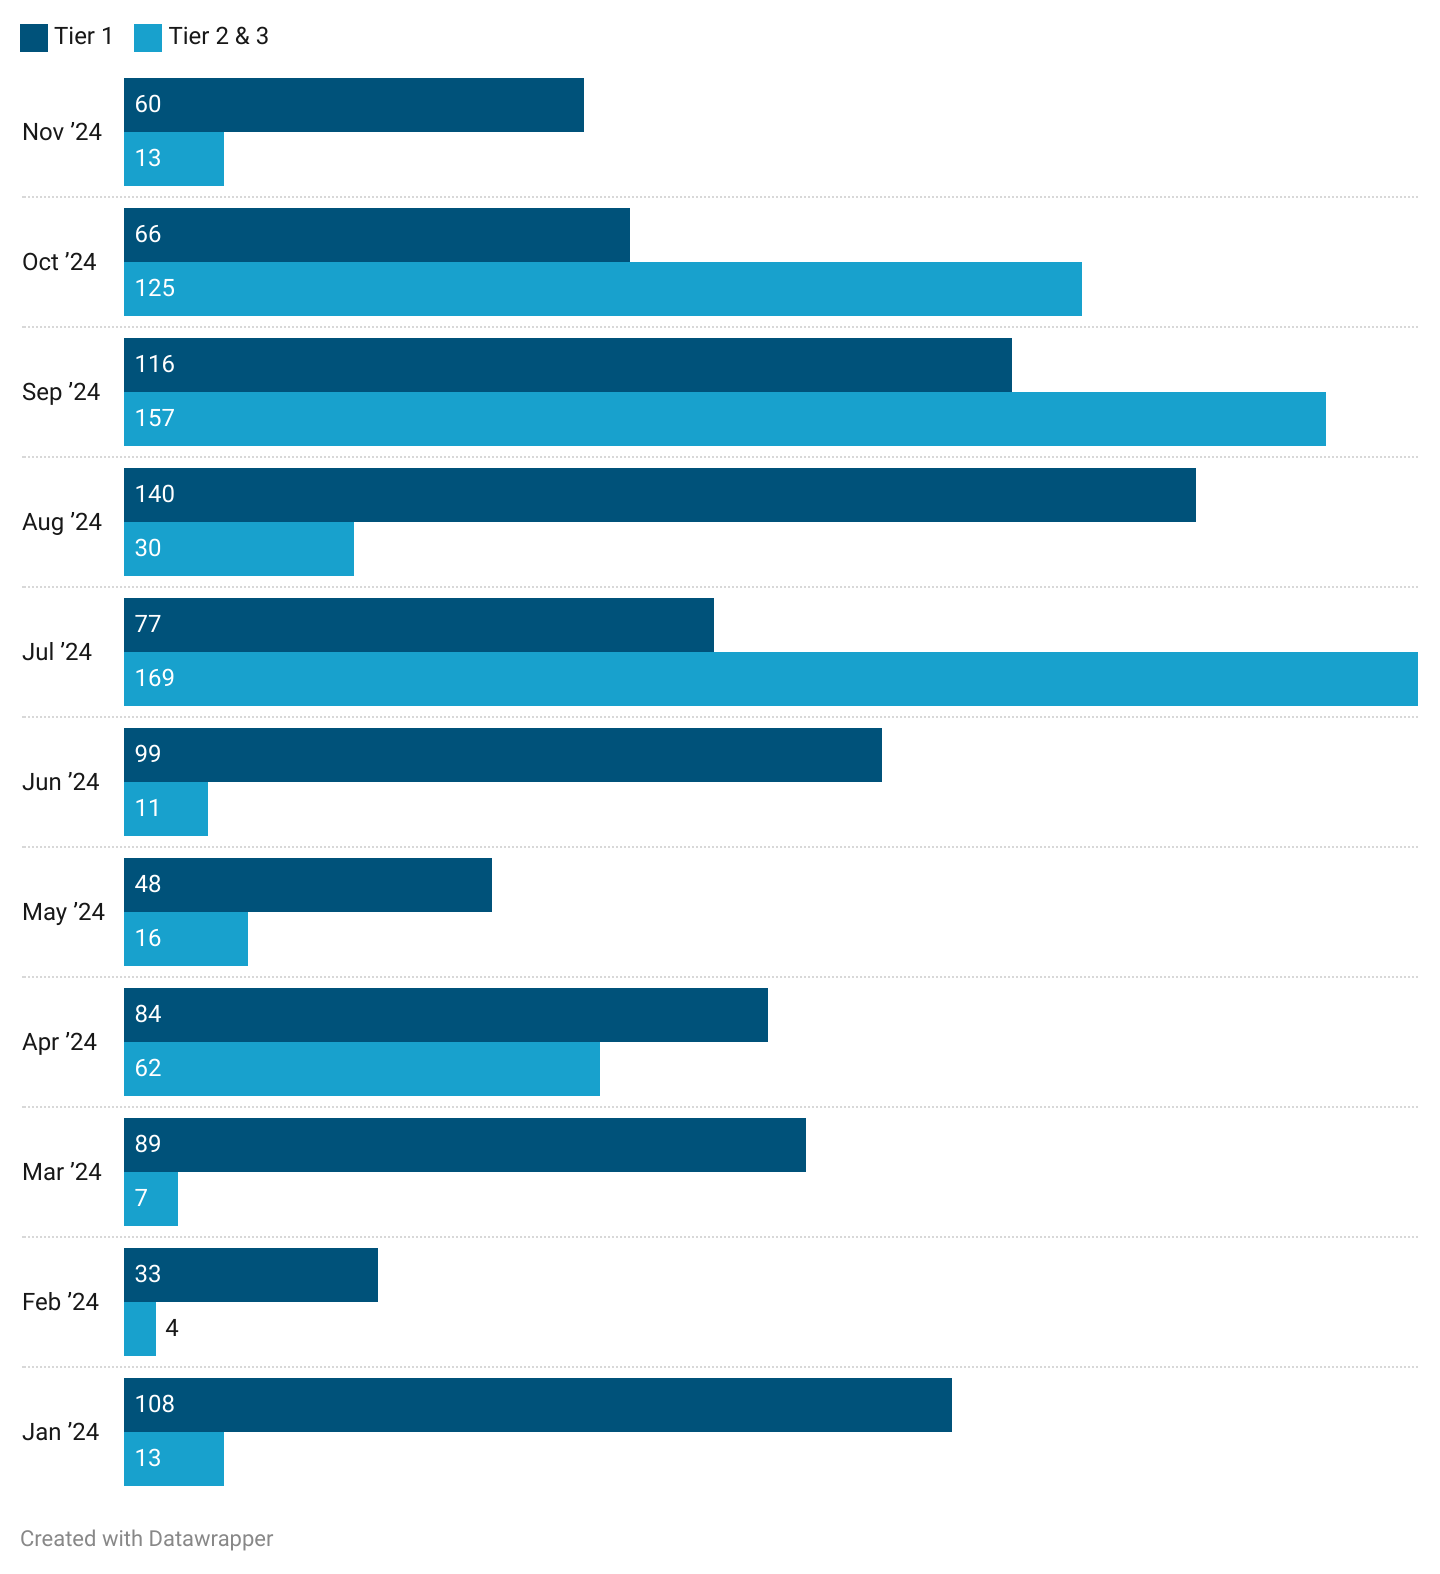
Avg. Deal Size for Tier 1-3 City Startups (₹ Cr)
The average deal size declined across both Tier 1 and Tier 2 & 3 cities. Tier 1 cities reported an average deal size of ₹60 crore, while Tier 2 & 3 cities averaged ₹13 crore.
Note: This does not include secondary and debt deals of unlisted Indian companies. Please note that 88 of our tracked deals were sourced from press reports as the corresponding MCA filings have not been made yet.
Investor Type by City Tier
VC/PE firms participated in 56 deals involving Tier 1 city startups, compared to just 5 in Tier 2 & 3 cities. Angel investors and family offices also remained focused on Tier 1 cities, reporting higher number of deals there as compared to smaller cities.
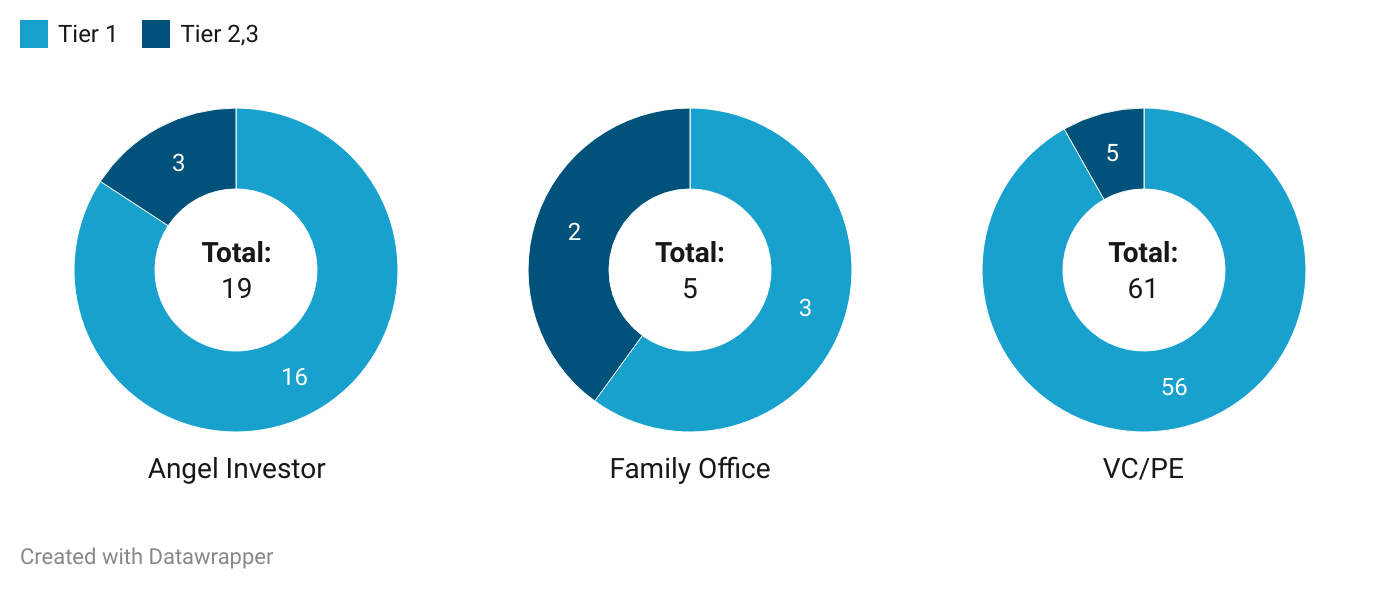
Note: Any funding deal can have participation from more than one type of investors(angel investor, family office etc) resulting in deals being counted more than once in this analysis.
Job Creation & Economic Impact
The funding landscape often correlates with job creation and broader economic growth. Startups that secure funding tend to expand rapidly, hiring new talent, scaling operations, and contributing to local economies.
With Delhi NCR, Mumbai, and Bengaluru securing the highest amounts of funding in November 2024, one can expect job creation to rise proportionately in these areas.
In smaller cities, although fewer deals were secured, the impact on local economies can still be significant, especially for high-growth startups that receive substantial investments.
These investments could spur regional job creation, particularly in sectors such as tech, e-commerce, and manufacturing. For example, Indore’s ₹110 crore deal could lead to the establishment of new tech ventures or scale existing ones, creating new opportunities for local talent.
The dip in funding for Tier 2 & 3 cities, however, may imply a slowdown in such job creation across these regions, calling for a strategic focus on enhancing investor confidence in smaller markets.
Comparative Analysis
From a peak of ₹14,029 crore in August, funding across Tier 1 cities fell to ₹6,205 crore in October, and further down to ₹4,588 crore in November. Similarly, Tier 2 & 3 cities saw a drastic drop in funding, from ₹1,743 crore in October to ₹202 crore in November.
While the deal size in Tier 1 cities remained relatively stable with an average of ₹60 crore, Tier 2 & 3 cities witnessed a sharp decline in average deal size, dropping from ₹125 crore in October to just ₹13 crore in November.
This indicates that larger, high-value deals are increasingly concentrated in Tier 1 cities, leaving smaller cities with deals of more modest proportions.
Conclusion
The startup funding landscape in India continues to be dynamic, though November 2024 saw a marked slowdown compared to the months before.
Tier 1 cities remain the dominant hubs of investment activity, but smaller cities are beginning to emerge as key players in this ecosystem.
The figures from November show that while the funding environment is cautious, opportunities for growth and investment remain, especially for entrepreneurs in the right markets.
Understanding these trends and adapting to the changing dynamics of the funding landscape will be crucial for both startups and investors moving forward.
As the Indian economy evolves, so too will the pathways for funding, with newer cities, sectors, and opportunities gradually coming into focus.
For further insights into 3 million+ companies and funding trends, check out our full analysis by signing up for a free trial!
Stay tuned for more in-depth analysis and insights on the latest trends in the startup world.

Follow us on social media for latest updates and insights into the dynamic landscape of Indian Private Markets.
Sign up on PrivateCircle Research to access data and insights on all things India Private Markets.
Data Curation by Nishmitha Devadiga and Subramanya U R from PrivateCircle.
Explore More City-Wise Startup Funding Recaps:
Monthly City-Wise Startup Funding Landscape: February 2024
Monthly City-Wise Startup Funding Landscape: March 2024
City-Wise Startup Funding Recap: April 2024
City-Wise Startup Funding Recap: May 2024
City-Wise Startup Funding Recap: June 2024
City-Wise Startup Funding Recap: July 2024
City-Wise Startup Funding Recap: August 2024