Introduction
Byju’s, India’s leading edtech company, has been the subject of much scrutiny and interest, particularly regarding its performance in the fiscal year 2022-23.
Let’s delve into some key aspects of Byju’s operations and financials to gain a comprehensive understanding.
- Headquarter – Bengaluru, Karnataka, India
- Sector – Education
- Founders – Byju Raveendran & Divya Gokulnath
- Founded – 2011
What is the Historical Performance Summary Report?
Historical Performance Summary Report is our endeavor to delve deeper into a company’s market performance across the years, all through the lens of data.
As a robust data intelligence platform, these reports serve as a testament to the capabilities of the PrivateCircle Research dashboard.
Why Byju’s?
Byju’s saga is one of the most talked about stories in the recent months. From the company’s rumored 90% valuation cut, to a very public investor vs founder brawl – the fate of Byju’s has everyone’s attention. This prompted us to also attempt drawing a storyline of Byju’s using various financial data points in this report.
These data points include the edtech company’s fundraising journey over the years, Revenue and Profit after Tax (PAT) in the last 3 years, Income breakdown, Expenses breakdown, Employee count, and Diluted shareholding.
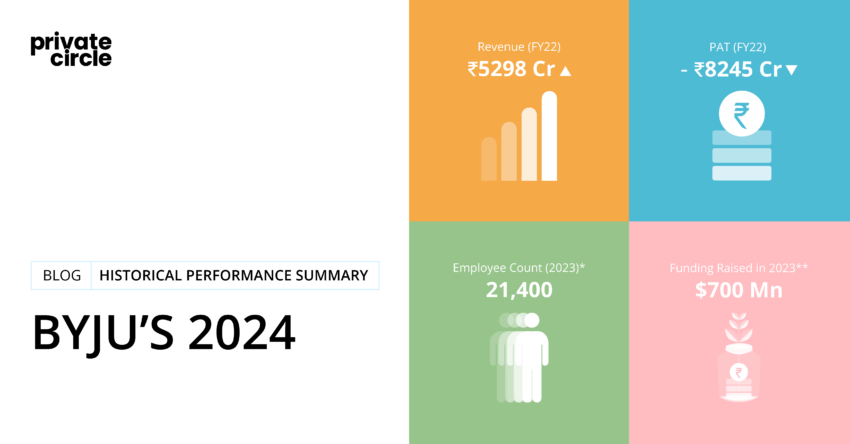
In FY22, Byju’s experienced a significant 80% increase in losses, even amidst a substantial 118% surge in revenue compared to the previous fiscal year.
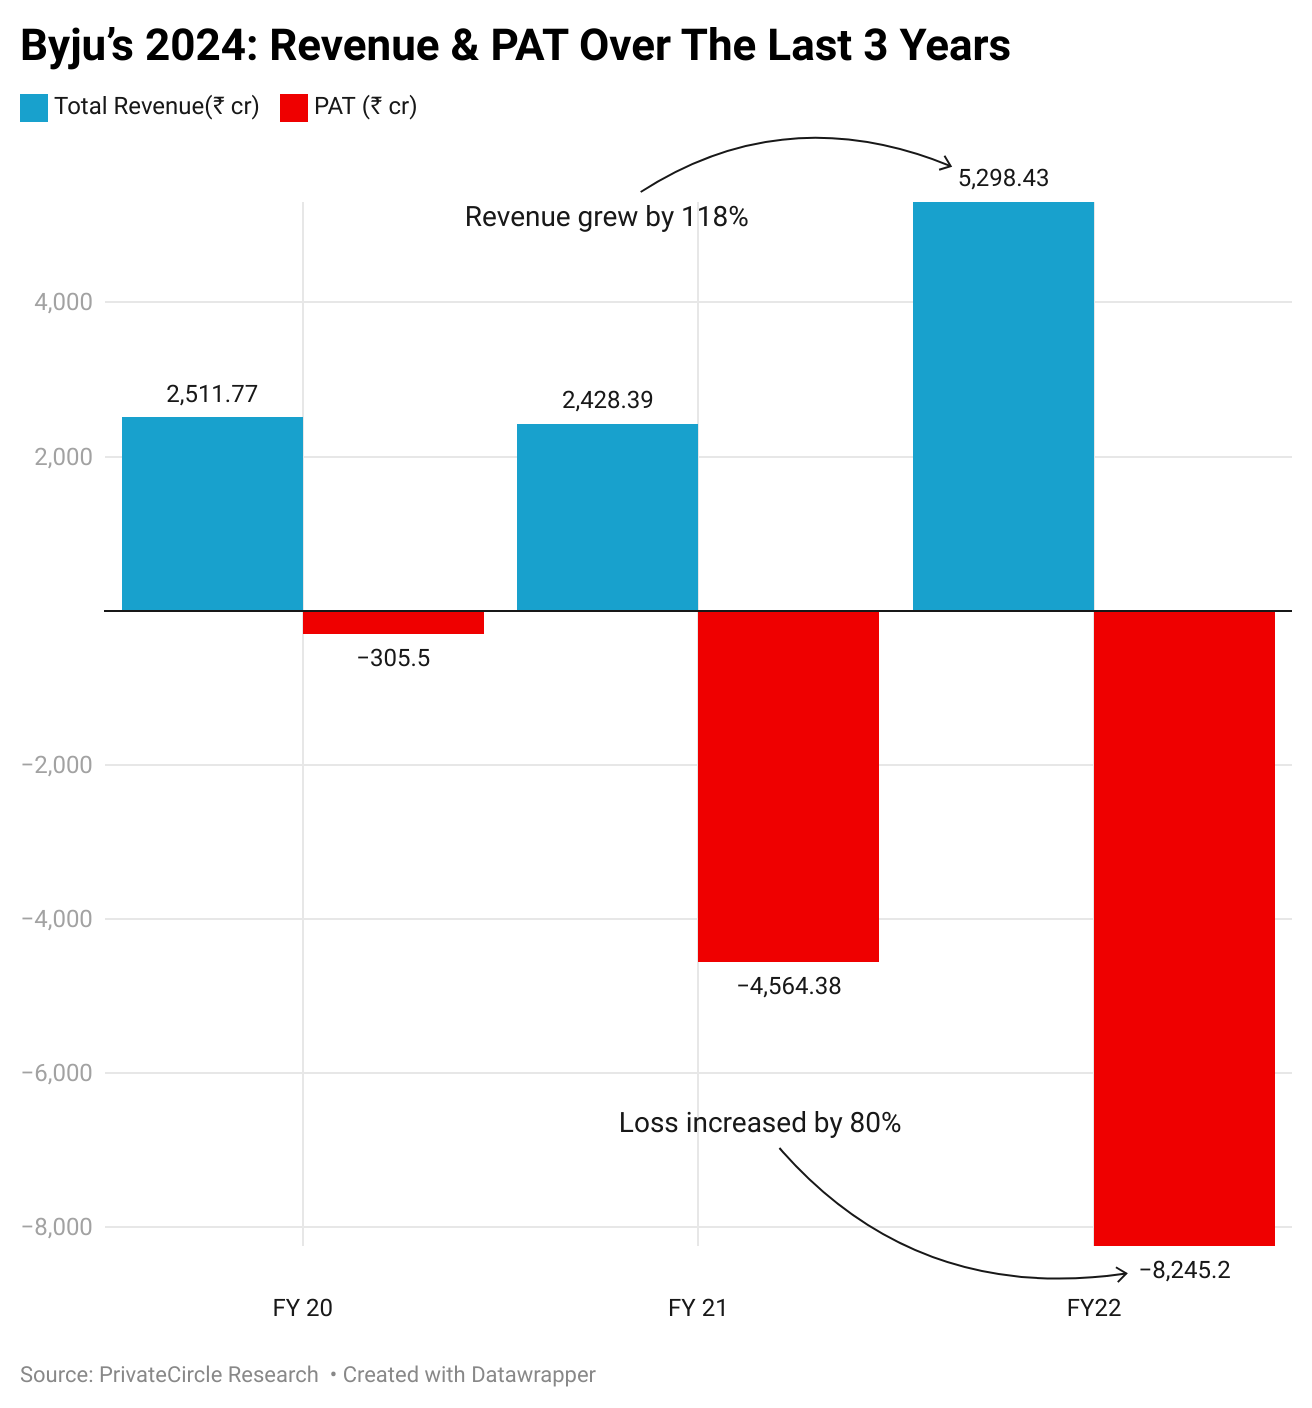
This juxtaposition raises questions about the company’s operational efficiency and cost management strategies.
An intriguing shift in revenue composition was observed, with the sale of edutech products accounting for 54% of total revenue in FY2022, down from 76% in FY2021.
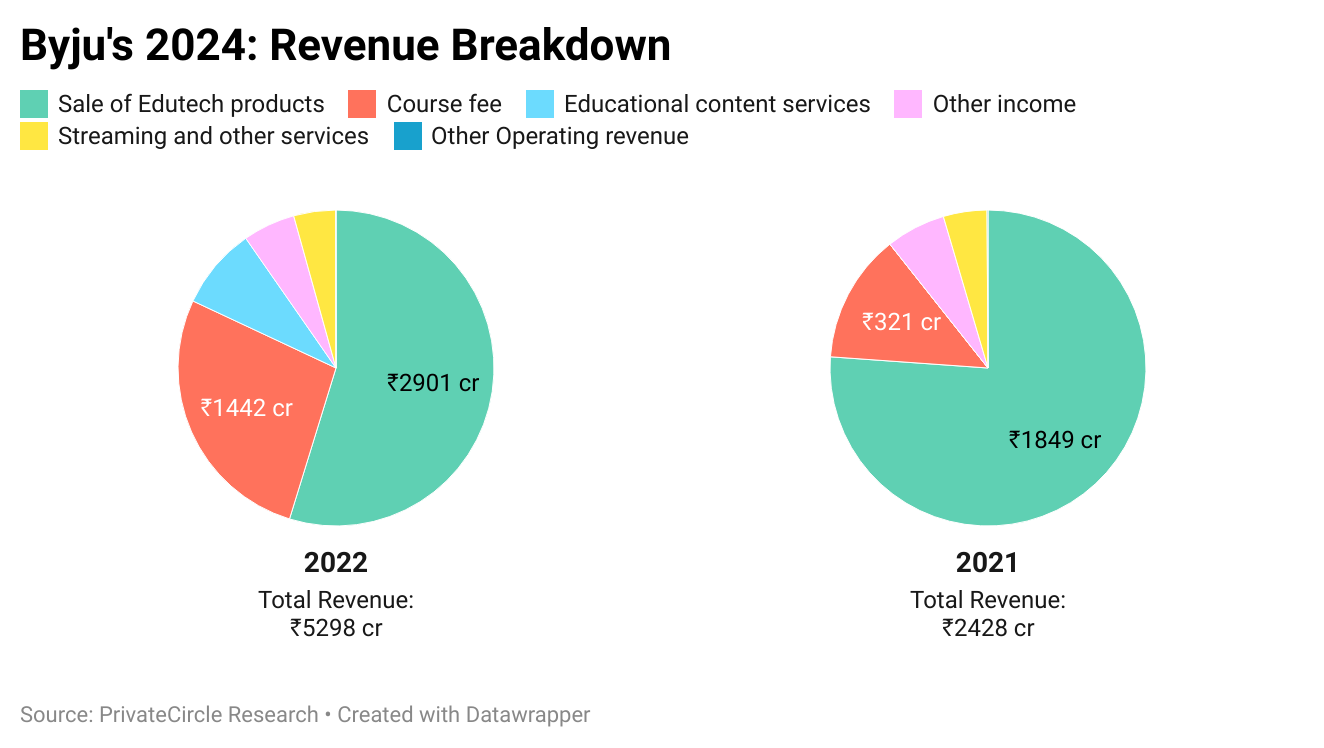
Notably, the share of course fees increased to 27% from 13% in the previous year, signaling a diversification in revenue streams. Additionally, the contribution of educational content services witnessed a remarkable upsurge, becoming the third-largest revenue source.
Byju’s witnessed a nearly doubled expenditure in FY22 compared to the preceding year.
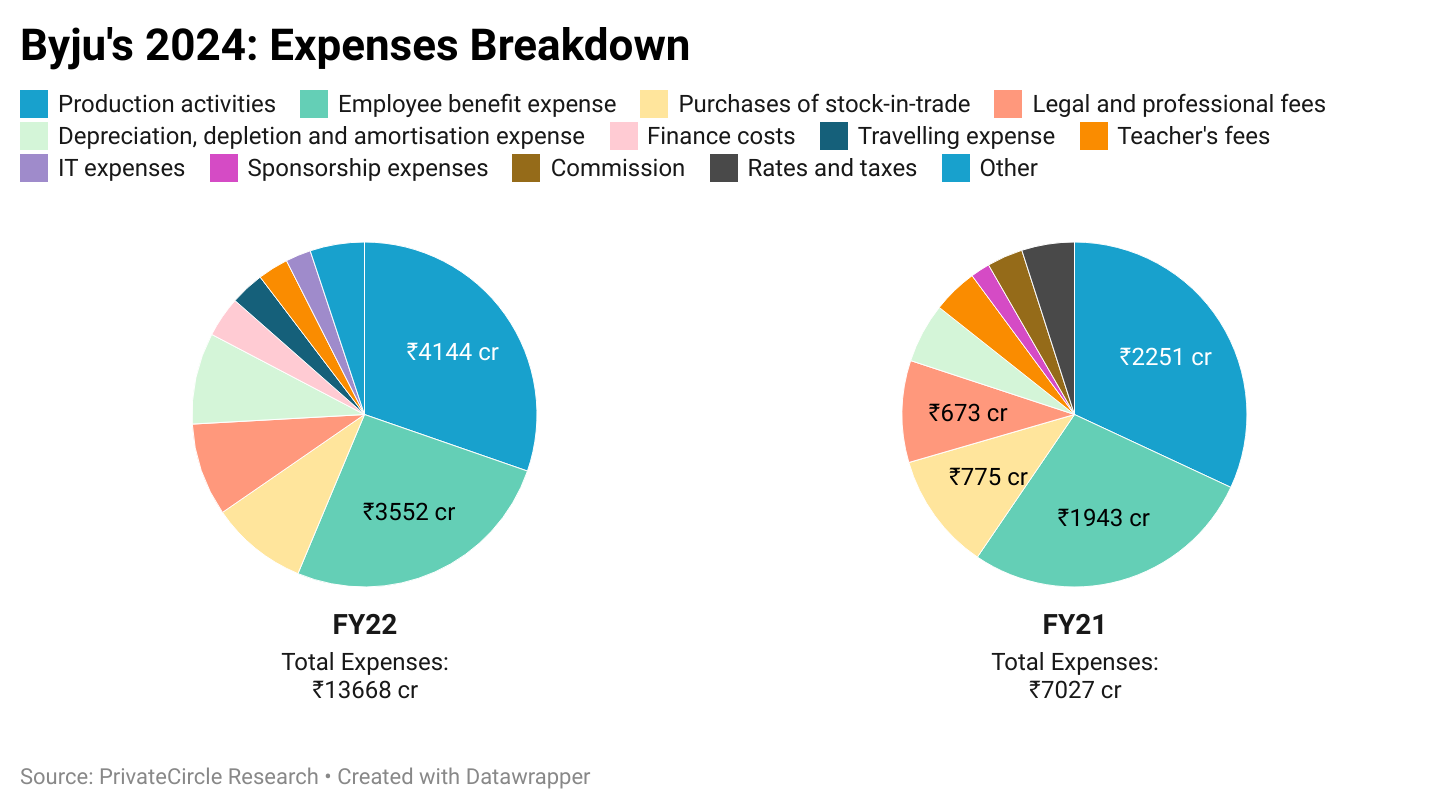
Significant increases were observed across various expense heads, including production activities, employee benefits, and legal expenses. These factors contributed to the substantial loss incurred by the company during the fiscal year.
The year 2020 marked a milestone for Byju’s, as it raised a staggering $1.6 billion in funding, reflecting the heightened interest in online education during the Covid-19 pandemic.
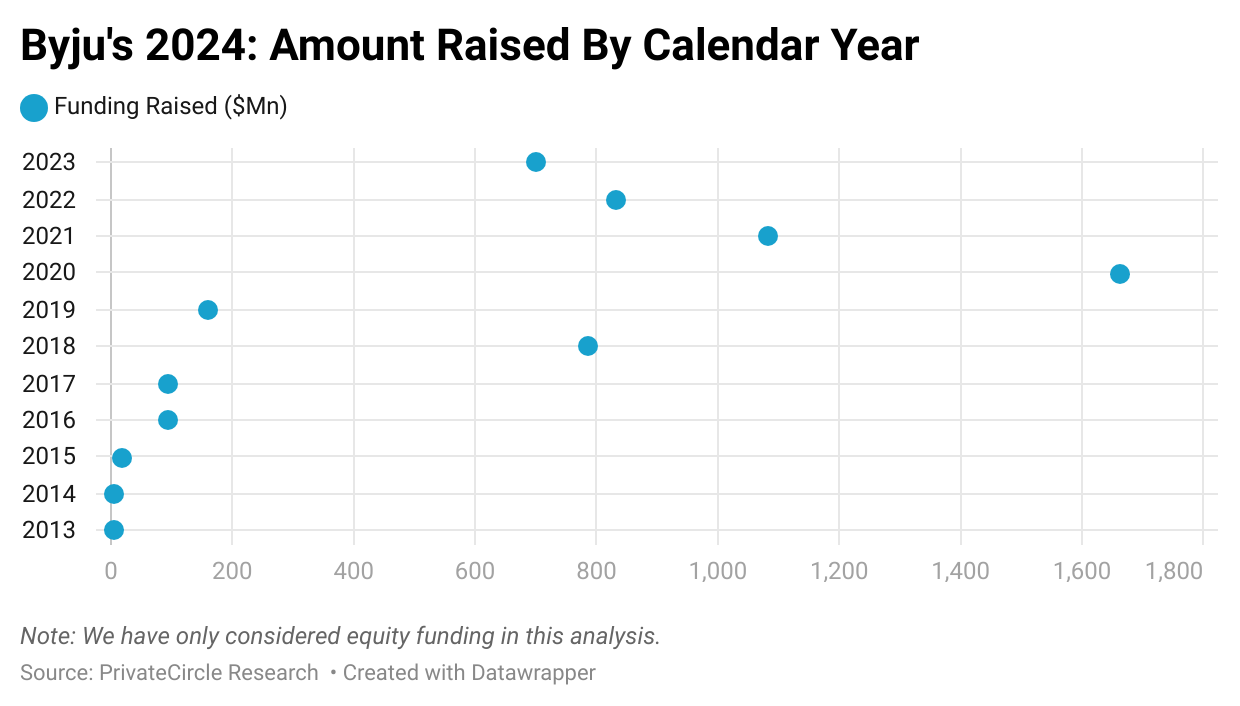
This influx of funds undoubtedly played a crucial role in fueling the company’s expansion and innovation efforts.
Byju Raveendran, along with Divya Gokulnath and Riju Ravindran, holds approximately 21% of Byju’s shares, indicating strong promoter confidence in the company’s future prospects.
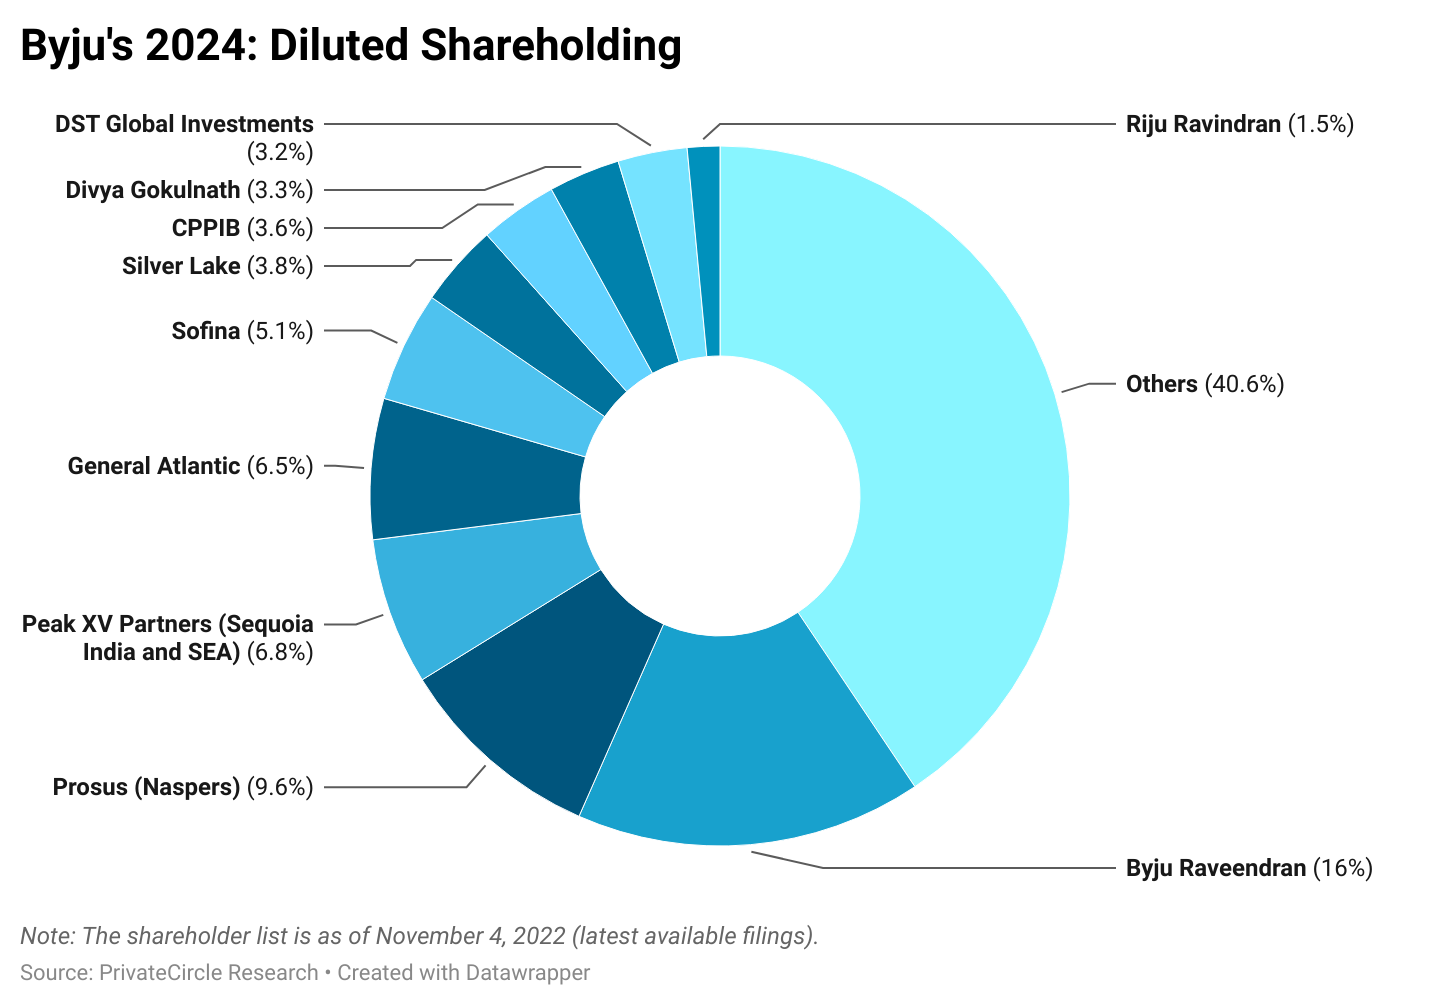
Notably, Prosus (Naspers) emerges as the second-largest shareholder, underscoring Byju’s appeal to global investors.
Byju’s experienced a significant surge in its workforce, reaching a peak of 67,000 employees in March 2022.
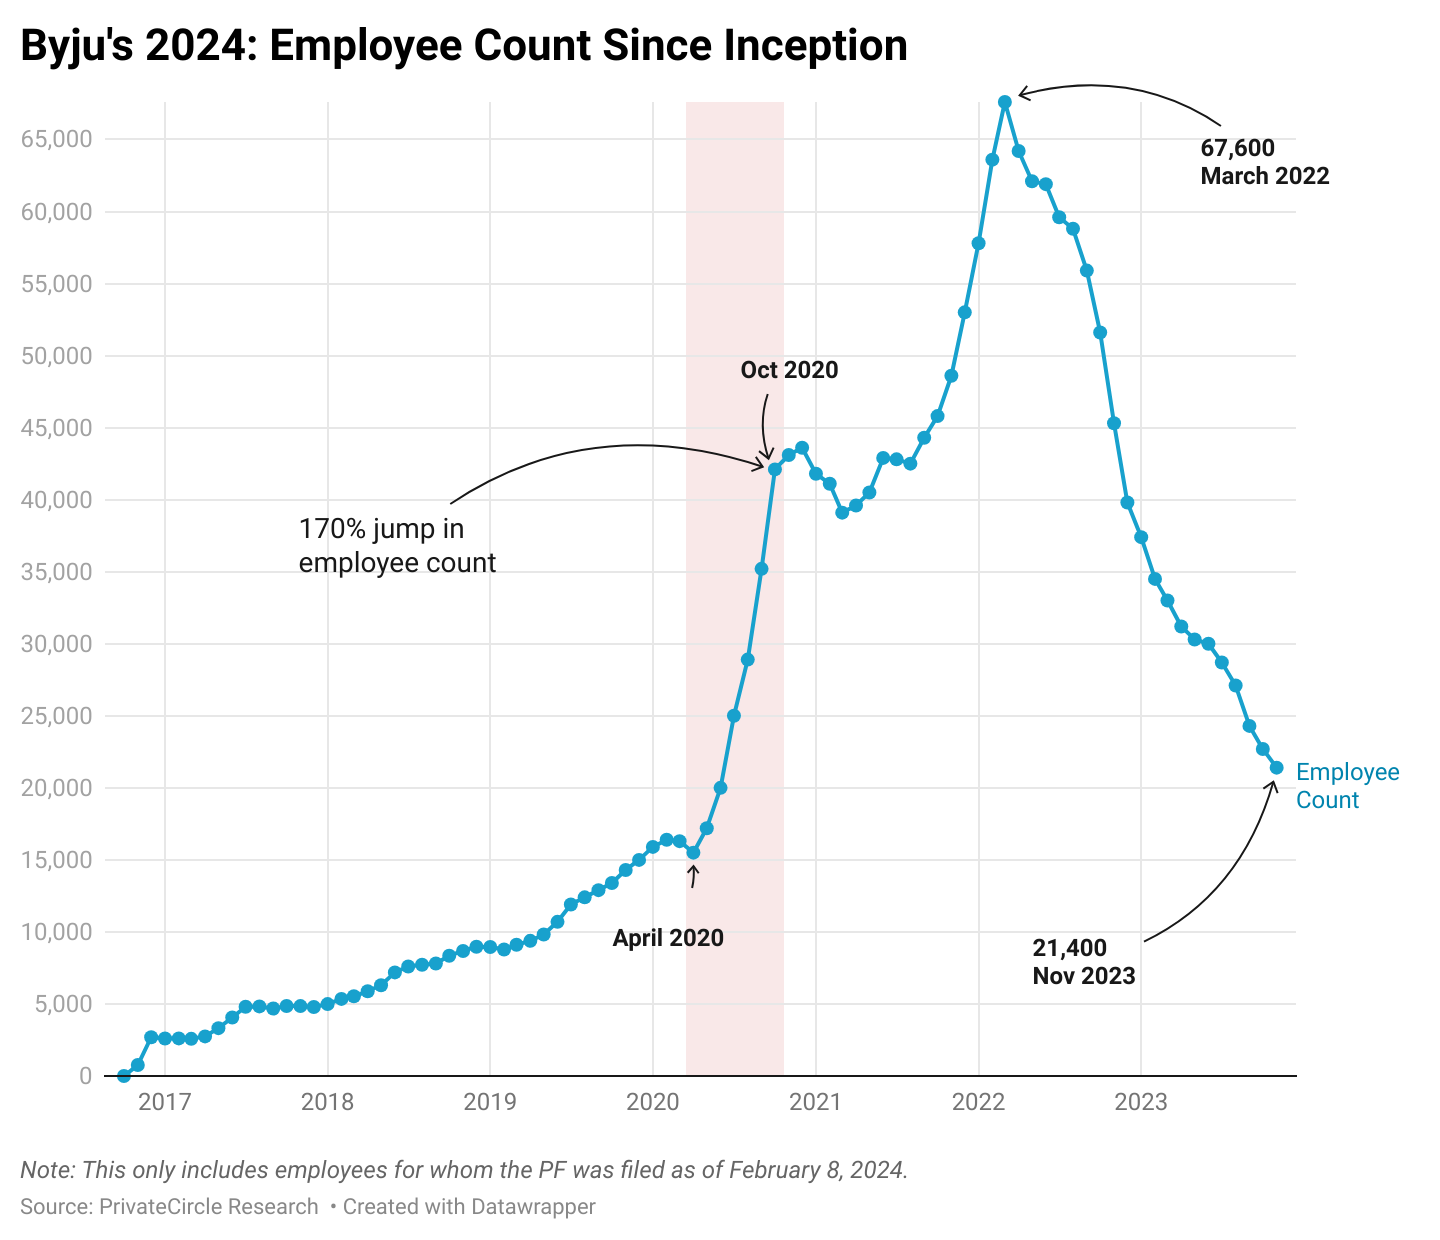
This surge was particularly notable following the Covid-19 outbreak in 2020, with a staggering 170% increase in the workforce within a span of just six months.
Byju’s Peers
- Vedantu Innovations Private Limited (Vedantu) with Revenue ₹1.9 Bn FY 2022 and 3-yr CAGR 150.08% FY 2022
- Upgrad Education Private Limited (upGrad) with Revenue ₹11.9 Bn FY 2023 and 3-yr CAGR 94.41% FY 2023
- Physicswallah Private Limited (PhysicsWallah) with Revenue ₹8.0 Bn FY 2023 and 2-yr CAGR 471.41% FY 2023
Conclusion
Byju’s performance in 2023 reflects a dynamic landscape characterized by rapid revenue growth, evolving revenue compositions, and strategic challenges in managing escalating expenses.
As the company continues to navigate through these complexities, investors and stakeholders remain keenly observant of its trajectory and future endeavors.

Curious about how you can effortlessly uncover such comprehensive analyses in a matter of minutes? Sign up on our platform – privatecircle.co/research – and discover firsthand.
Take advantage of our FREE trial/demo to gain access to dependable data, intelligence, and insights.
Empower your research across 1.7 million private unlisted companies spanning 500+ data categories with unwavering confidence.
More HPSRs from PrivateCircle Research
Historical Performance Summary Report: CleanMax 2023
Historical Performance Summary Report: WayCool 2023
Historical Performance Summary Report: Dunzo 2023

Excellent data, thanks!
Do you happen to have the finance balance sheet? If not, where can I get it?
Looking forward to your reply.
Elena
Thank you Elena.
You can access the balance sheet and a lot more here https://privatecircle.co/research/
Just sign up for the free trial and get access instantly.
Cheers