This multifaceted report unveils the heartbeat of entrepreneurship, dissecting funding trends across the nation’s vibrant metropolises.
From Bengaluru’s meteoric rise to tier 2 & 3 cities’ promising growth trajectories, join us as we decode the dynamics shaping India’s startup ecosystem.
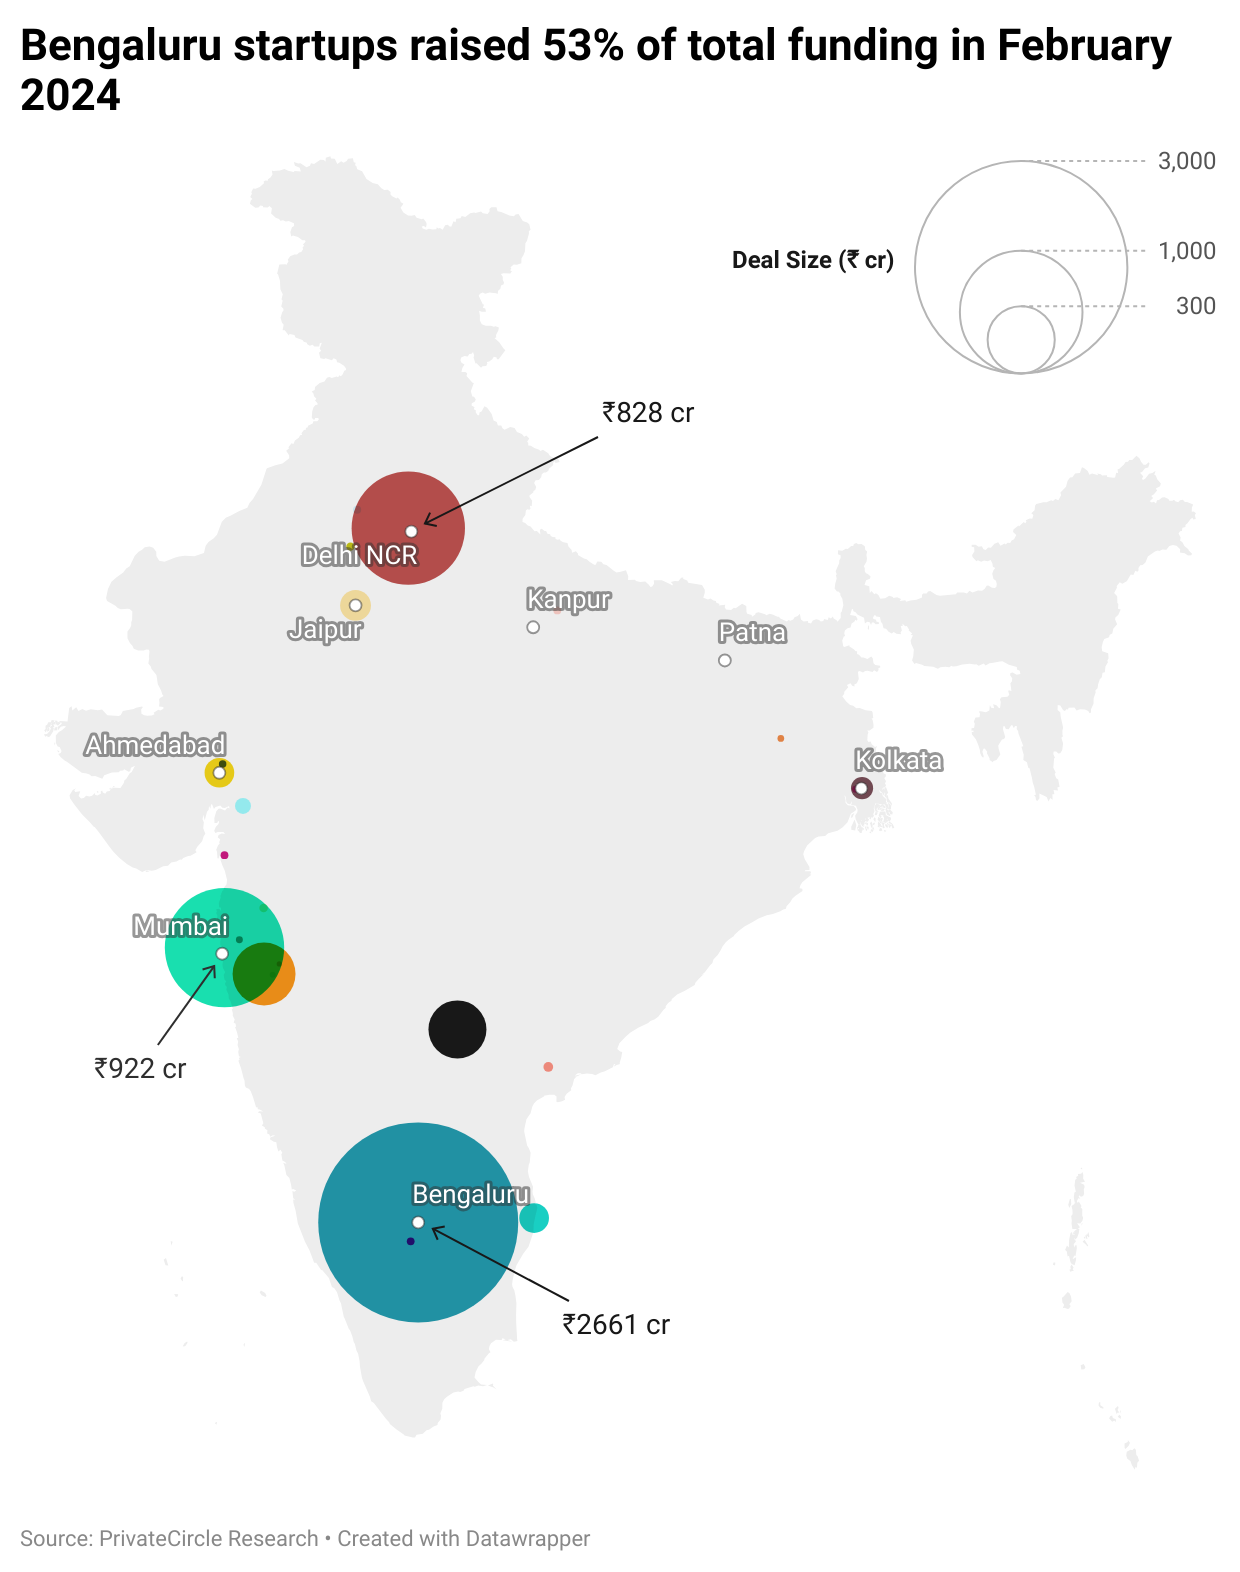
The top three cities leading the charge were Bengaluru, Mumbai, and Delhi NCR, painting a vibrant picture of entrepreneurial fervor across the nation.
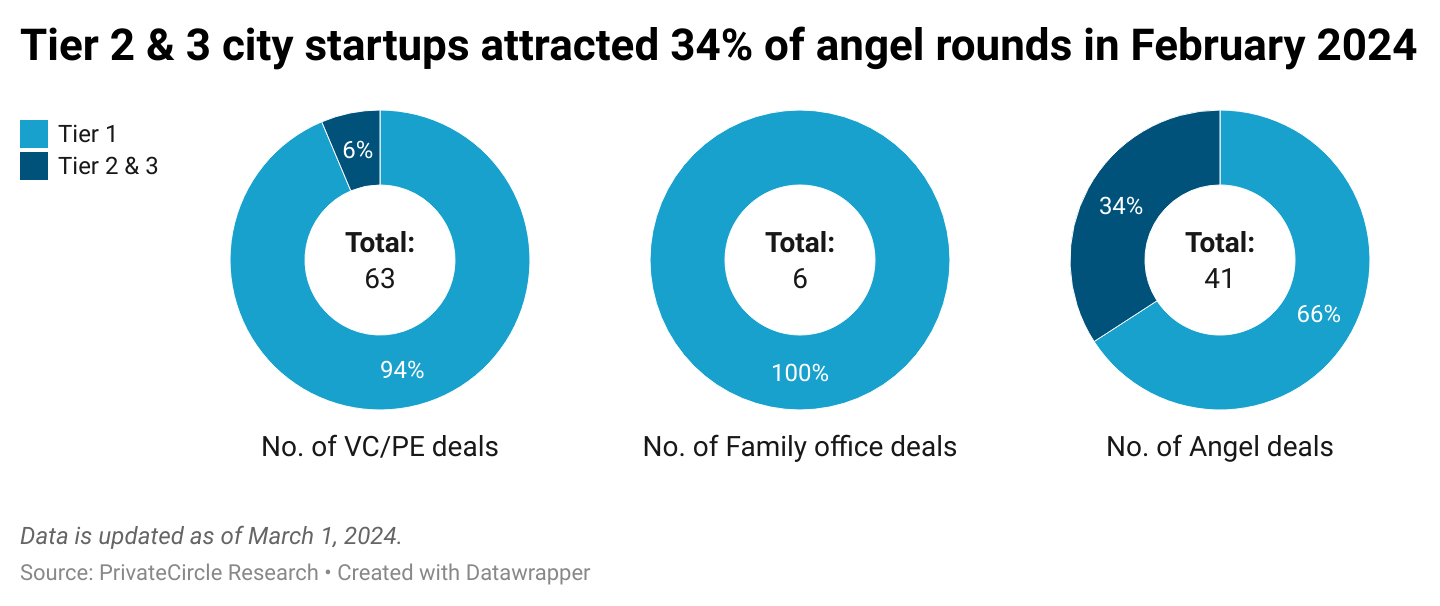
While tier 1 cities hogged the limelight, tier 2 & 3 cities showcased promising growth trajectories, attracting 34% of angel funding rounds.
However, the disparity was evident, with VC/PE deals scant in these regions, comprising only 6% of total investments.
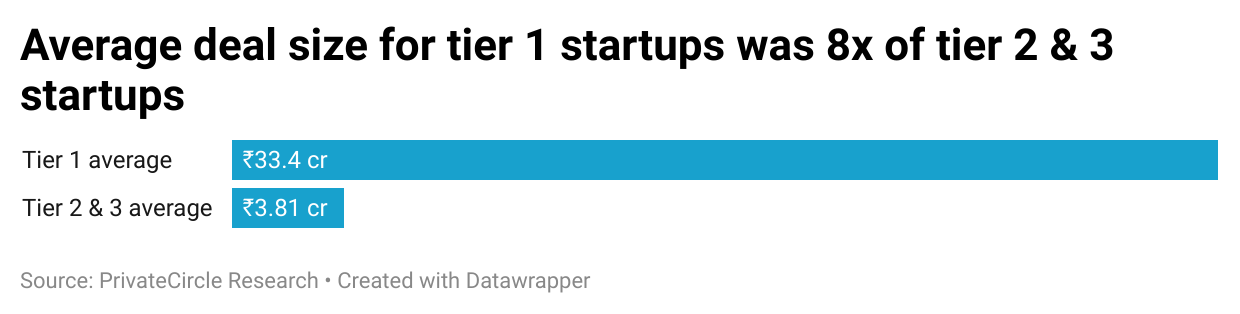
The urban hierarchy was starkly reflected in deal sizes, with tier 1 startups commanding an average eight times larger investment than their tier 2 & 3 counterparts.
This dichotomy underscores the evolving investment landscape and the differential support received by startups based on their geographical location.
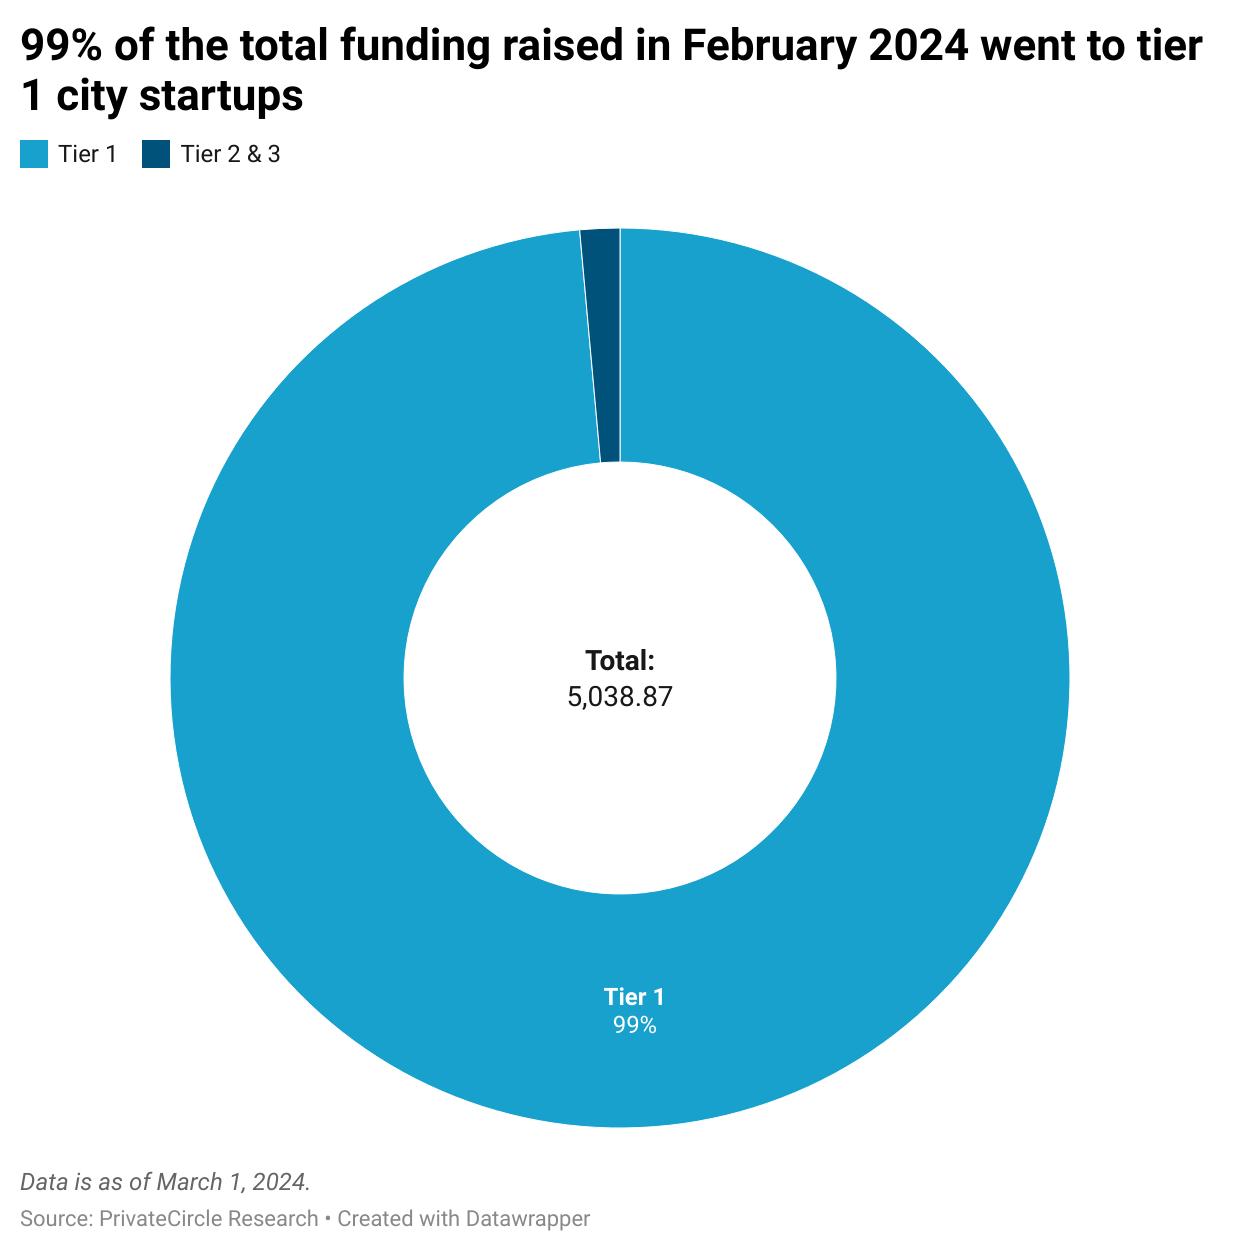
A whopping 99% of total funding gravitated towards tier 1 city startups, with a staggering ₹4967 crores raised, dwarfing the ₹72 crores garnered by tier 2 & 3 counterparts.
The disparity in funding allocation highlights the need for equitable investment distribution to foster holistic growth across all regions.
Conclusion
As India’s startup ecosystem continues to burgeon, understanding the nuanced dynamics of urban funding becomes paramount.
While tier 1 cities dominate the investment landscape, tier 2 & 3 cities exhibit untapped potential, beckoning investors to explore emerging opportunities beyond metropolitan boundaries.

Follow us on social media for latest updates and insights into the dynamic landscape of Indian Private Markets.