
India’s Private Markets is off to a powerful start in January 2025, with ₹9,482 crore ($1.1 billion) raised across 141 deals. This shows robust investor confidence and a thriving market.
Let’s break it down and take a look at the highlights from January, using some real-world insights to add color to the numbers.
City-Wise Funding Breakdown
India’s major funding hubs continue to attract the lion’s share of investment, with Tier 1 cities like Mumbai, Delhi NCR, and Bengaluru leading the charge.
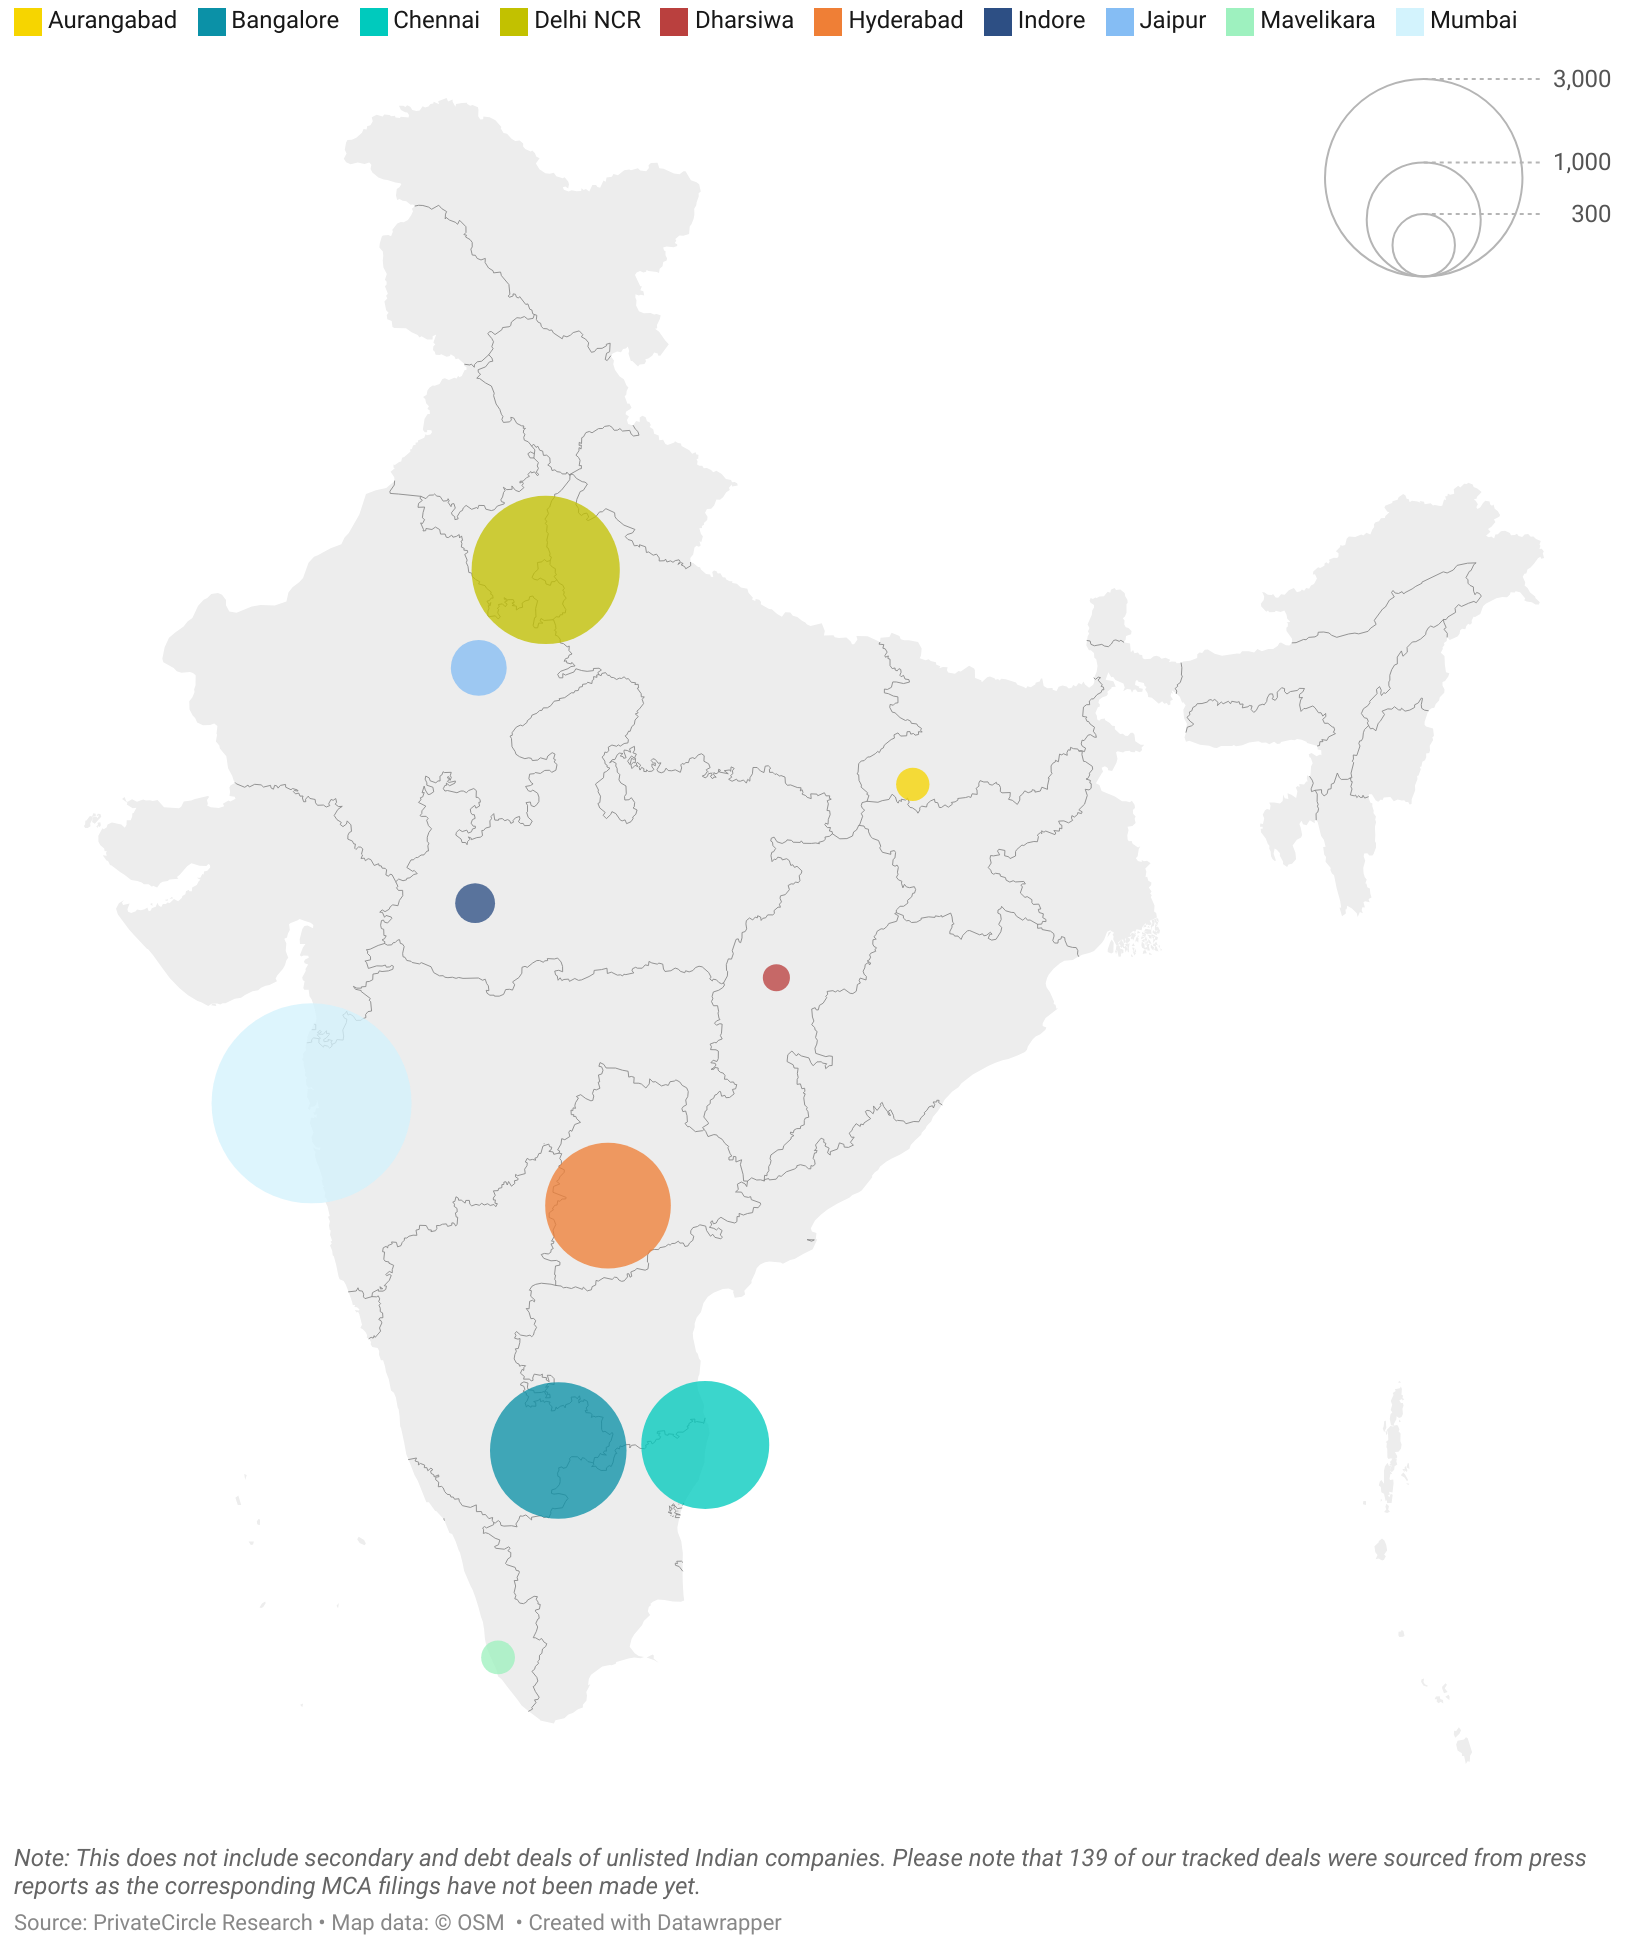
- Mumbai: ₹3,078 crore (27 deals)
- Delhi NCR: ₹1,667 crore (31 deals)
- Bengaluru: ₹1,407 crore (35 deals)
- Chennai: ₹1,231 crore (10 deals)
- Hyderabad: ₹1,186 crore (4 deals)
While Tier 1 cities are still the primary hotspots for investment, there is a noticeable increase in the traction gained by Tier 2 and 3 cities like Jaipur (₹216 crore) and Indore (₹103 crore), signaling that innovation is spreading beyond the usual suspects.
Deal Volume – Steady Activity Despite Fluctuations
The deal count has shown an interesting trend in the past few months. With January 2025 closing with 141 deals, the market is maintaining momentum from a peak in December 2024 with 142 deals.
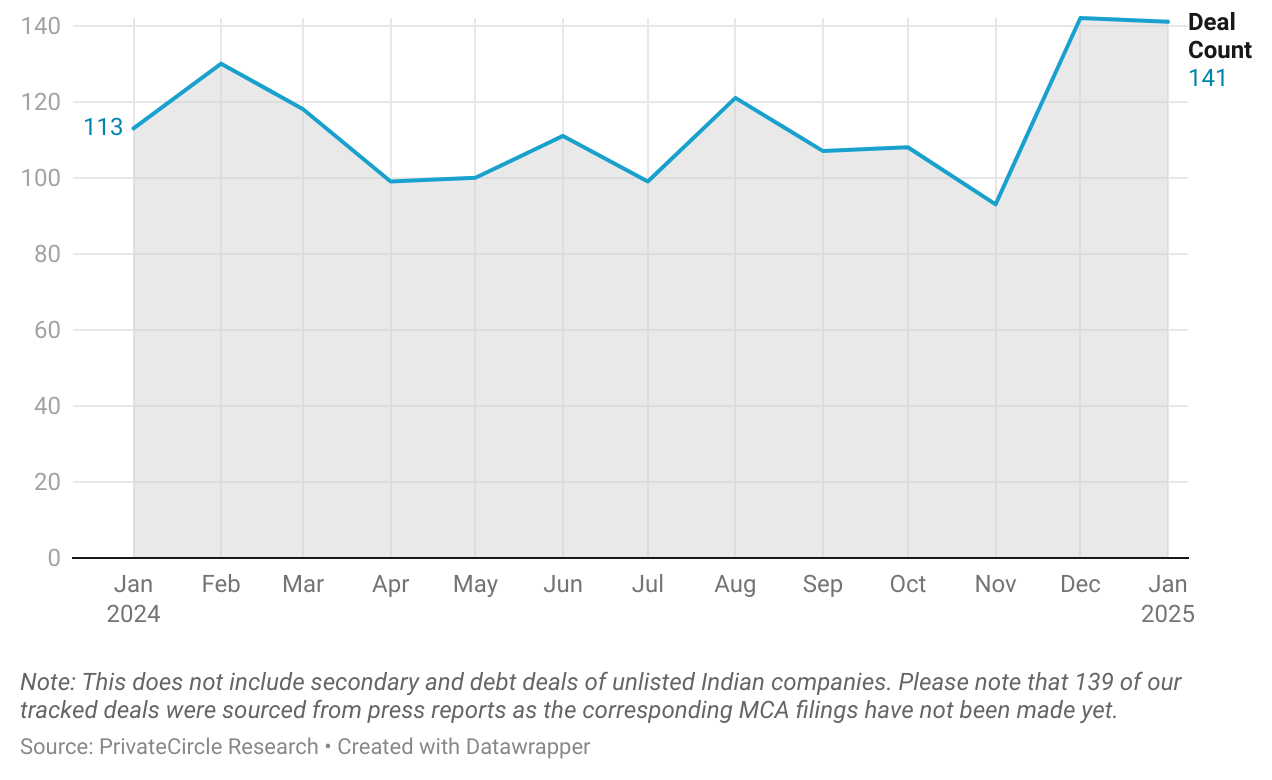
This marks a 24.8% increase in deal activity compared to the 113 deals recorded in January 2024, signaling a strong start of 2025 in private markets.
Real-World Insight: In a time of global uncertainty, investors are increasingly looking to back startups in India due to its massive market potential and a young, tech-savvy workforce.
Total Deal Value – A Year-on-Year Surge
The total funding raised has steadily increased over the months, from ₹4,116 crore in December 2023 to a massive ₹19,788 crore in December 2024.
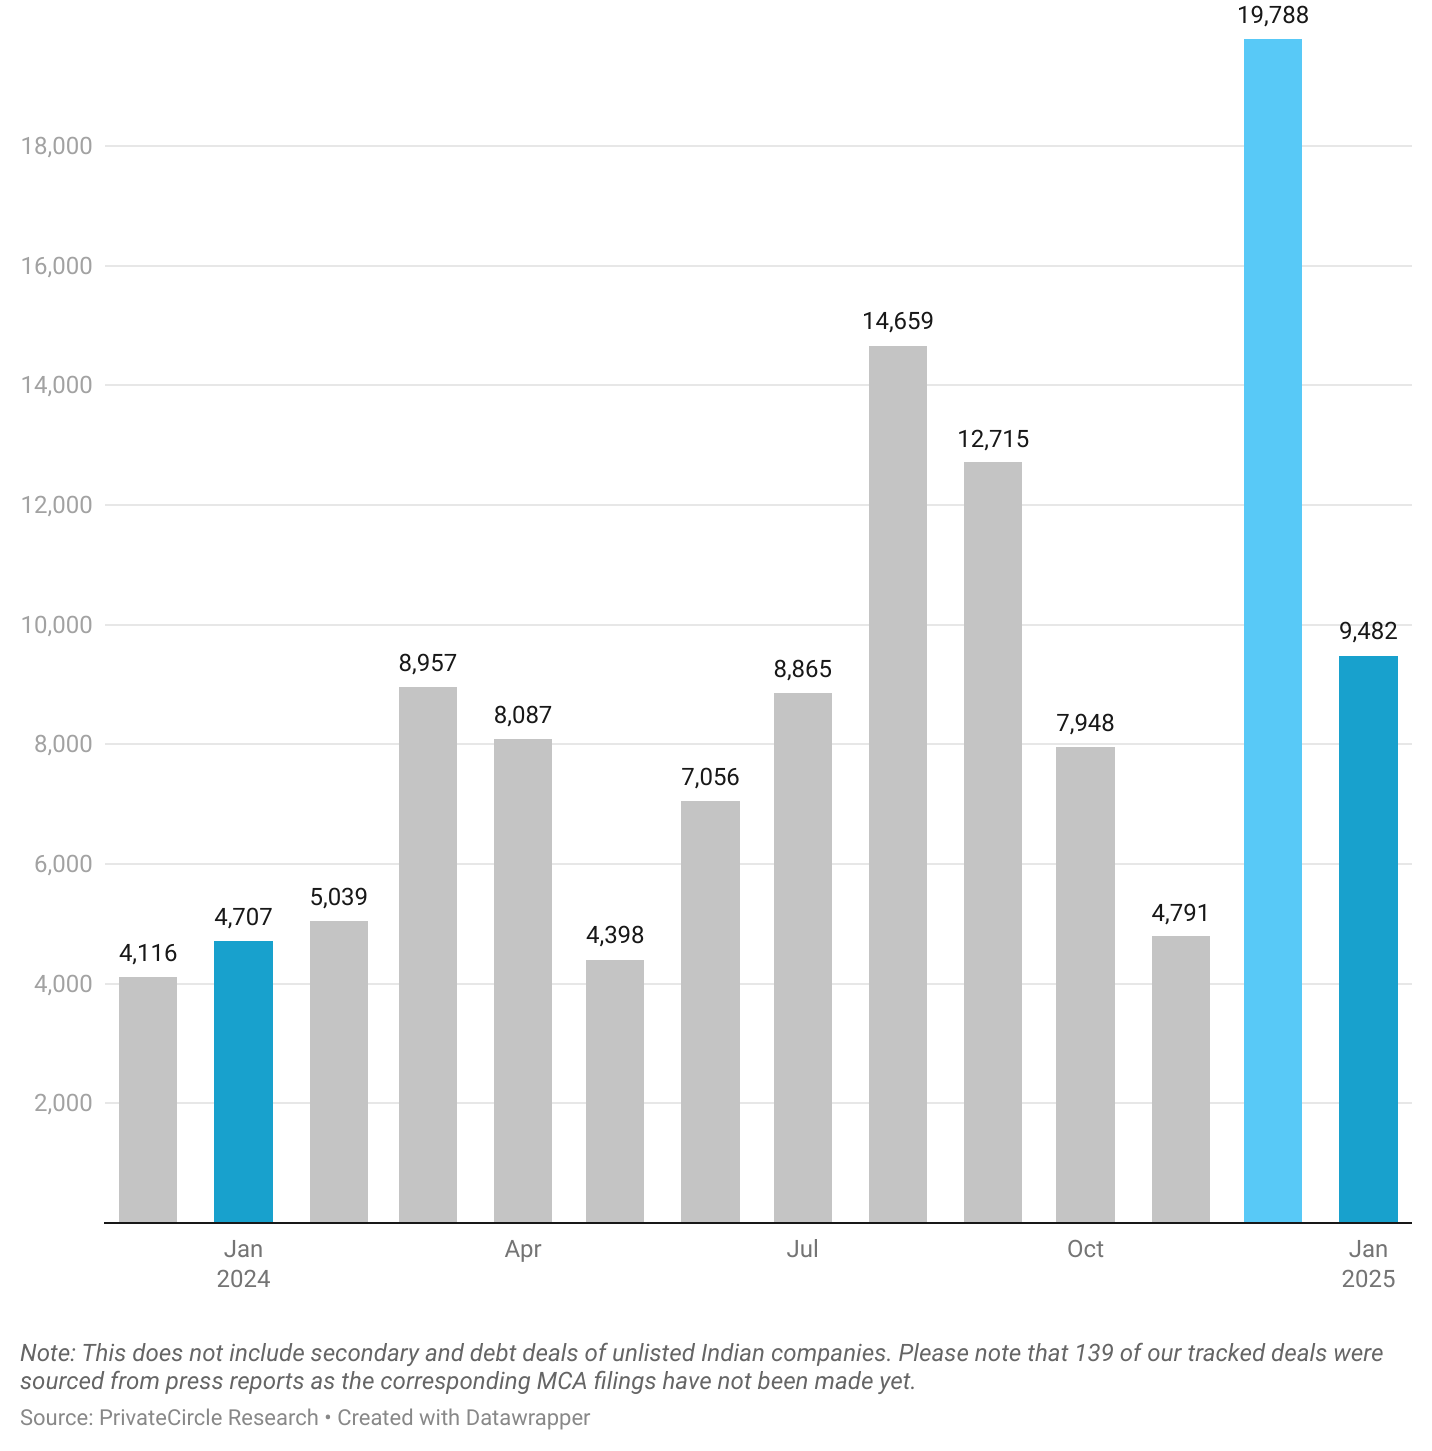
January 2025 maintained strong figures at ₹9,482 crore, which is 130% increase over January 2024.
The substantial spike in December 2024 demonstrates the typical end-of-year rush, but January’s performance indicates that the momentum isn’t slowing down.
Real-World Example: The strong uptick in funding can be linked to the year-end bonus rounds, where venture capital firms often deploy their remaining funds. This is a strategy used by many firms to maximize their annual budgets.
Top 3 Deals – The Big Movers
January’s funding was heavily concentrated in certain sectors, with the Top 3 Deals raising significant amounts.
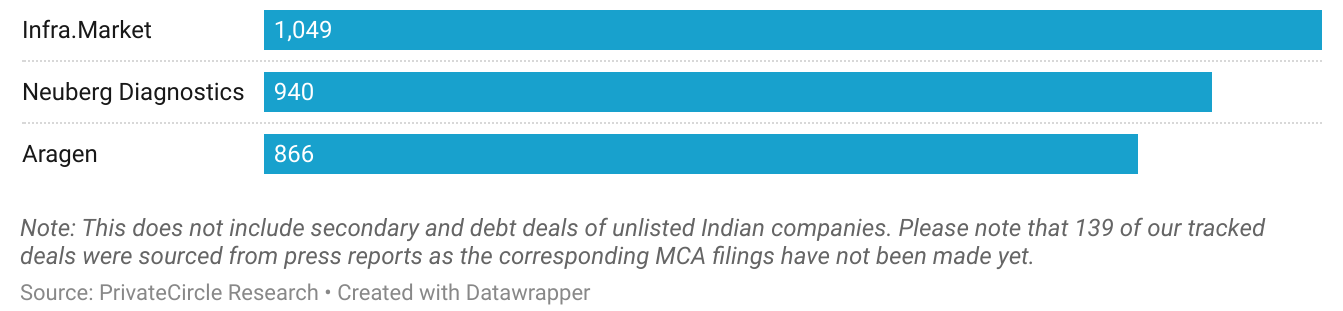
These deals show where the real action is: infrastructure, diagnostics, and biotechnology.
Infra.Market’s deal is especially notable, as the Indian infrastructure sector is receiving an enormous boost, with both private and government funding flowing into it.
Top Investors by Deal Volume – 100X VC Leads the Pack
The top investors by deal volume in January were:
- 100X VC: 16 deals
- All In Capital: 5 deals
- Devc India & Titan Capital: 4 deals each
Note: This does not include secondary and debt deals of unlisted Indian companies. Please note that 139 of our tracked deals were sourced from press reports as the corresponding MCA filings have not been made yet.
100X VC’s dominance in the deal space indicates their active role in nurturing early-stage startups.
It’s not uncommon for these investors to look for companies that have potential for rapid scaling – an area where they can leverage their expertise.
Investor Type by Deal Volume
This distribution mirrors trends from December 2024, where venture capital firms were the dominant players, though angel investment dipped slightly.
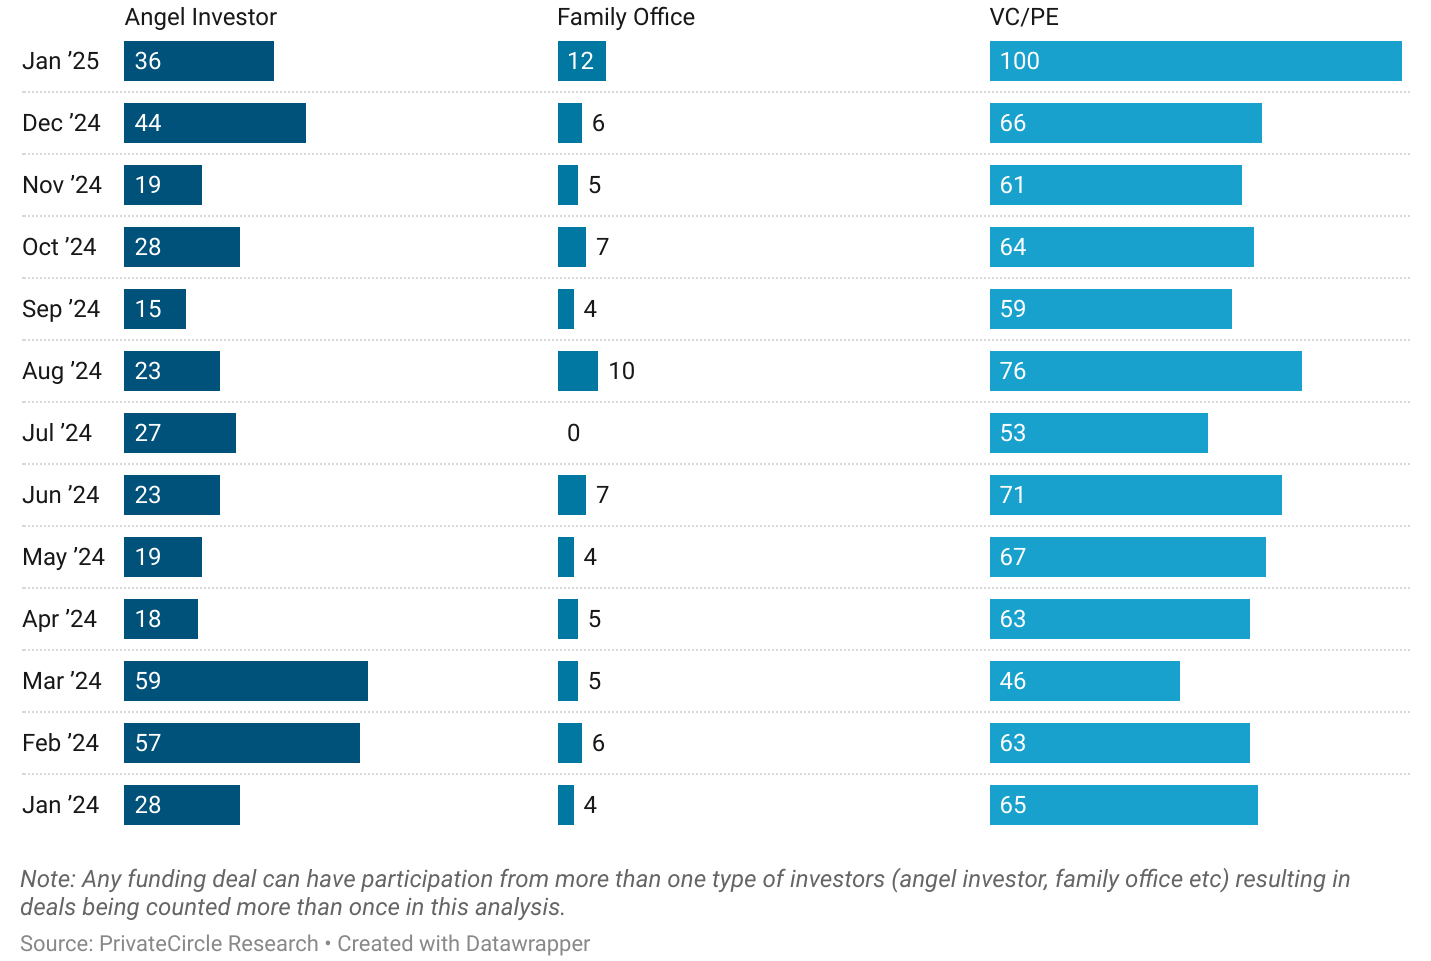
Angel investors still remain a force, especially in the early stages, but the larger deals and growth-stage investments are clearly the domain of VC and PE funds.
Funding Across Tier 1, 2 & 3 Cities – A Tale of Two Sectors
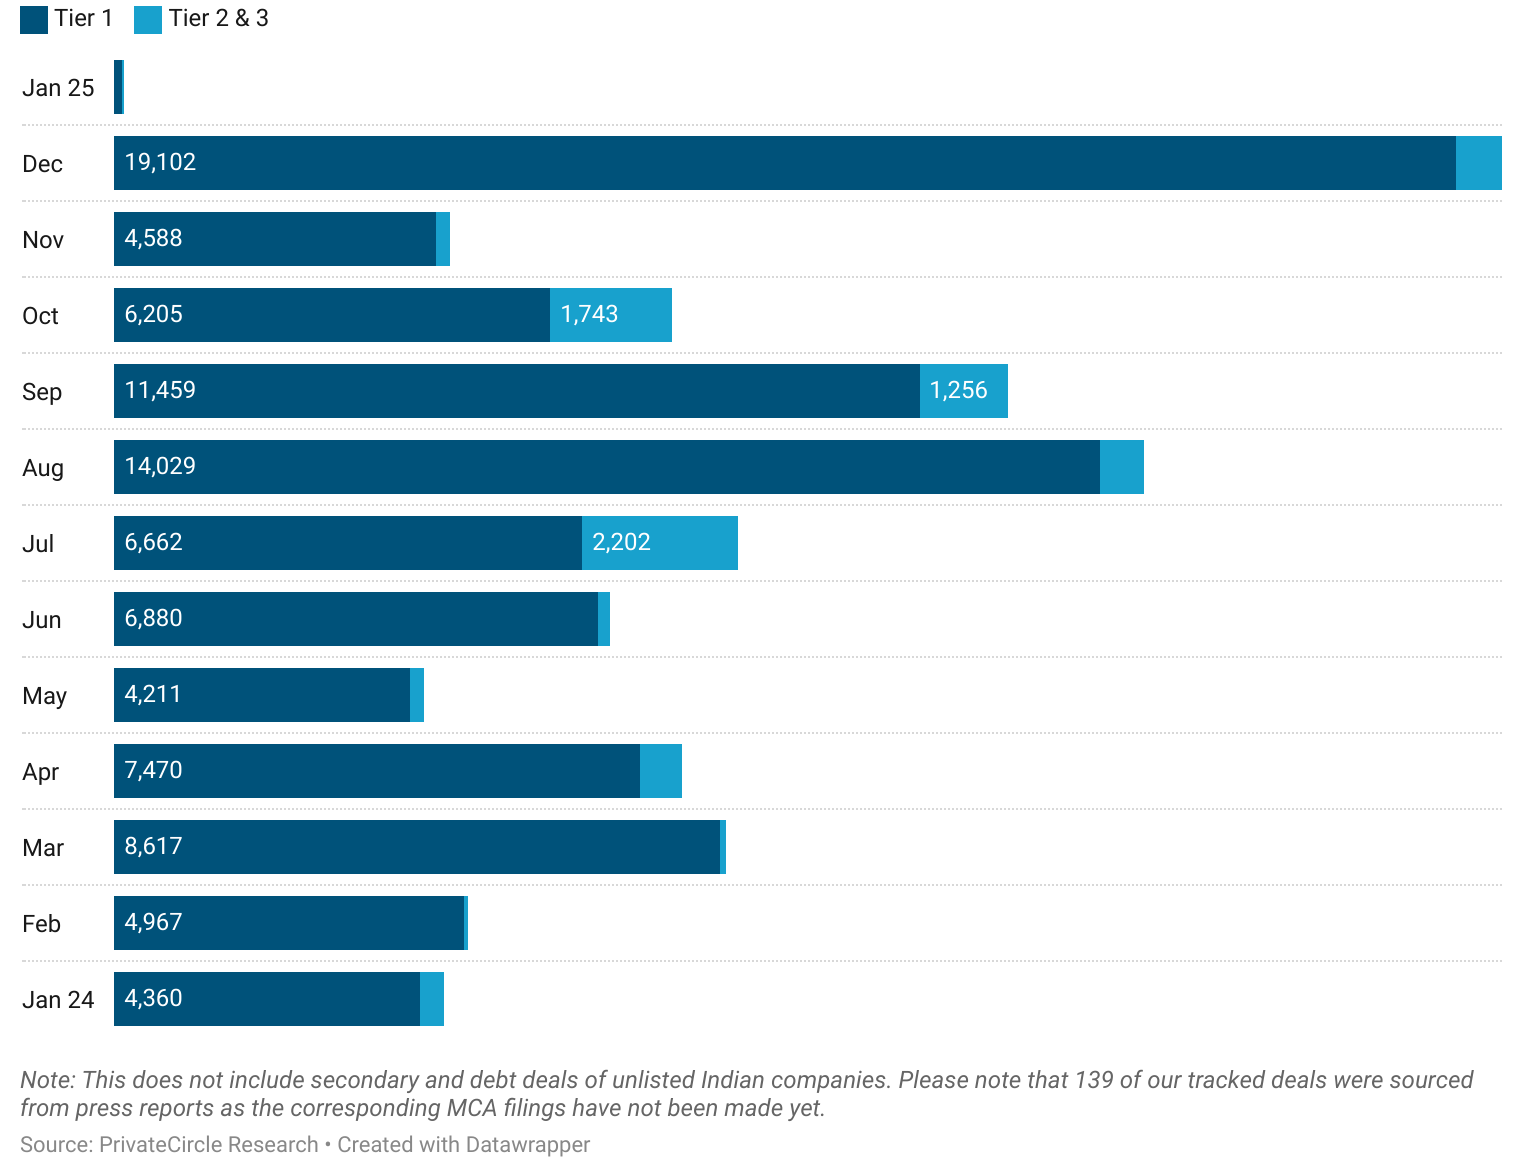
Looking at the funding distribution across city tiers, we notice an interesting divergence:
- Tier 1 cities raised ₹113 crore in January 2025, a significant drop from ₹19,102 crore in December 2024.
- Meanwhile, Tier 2 & 3 cities raised ₹28 crore, maintaining relatively consistent funding volumes compared to previous months.
This drop in Tier 1 cities could be due to a variety of factors, including a natural post-holiday dip or a reduction in mega deals.
Nonetheless, Tier 1 cities still dominate, and we expect this trend to continue in the foreseeable future.
Average Deal Size – Tier 1 vs Tier 2 & 3 Cities
As for average deal size, there’s a noticeable difference:
- Tier 1 Cities: ₹76 crore (larger, more mature deals)
- Tier 2 & 3 Cities: ₹30 crore (smaller, emerging deals)
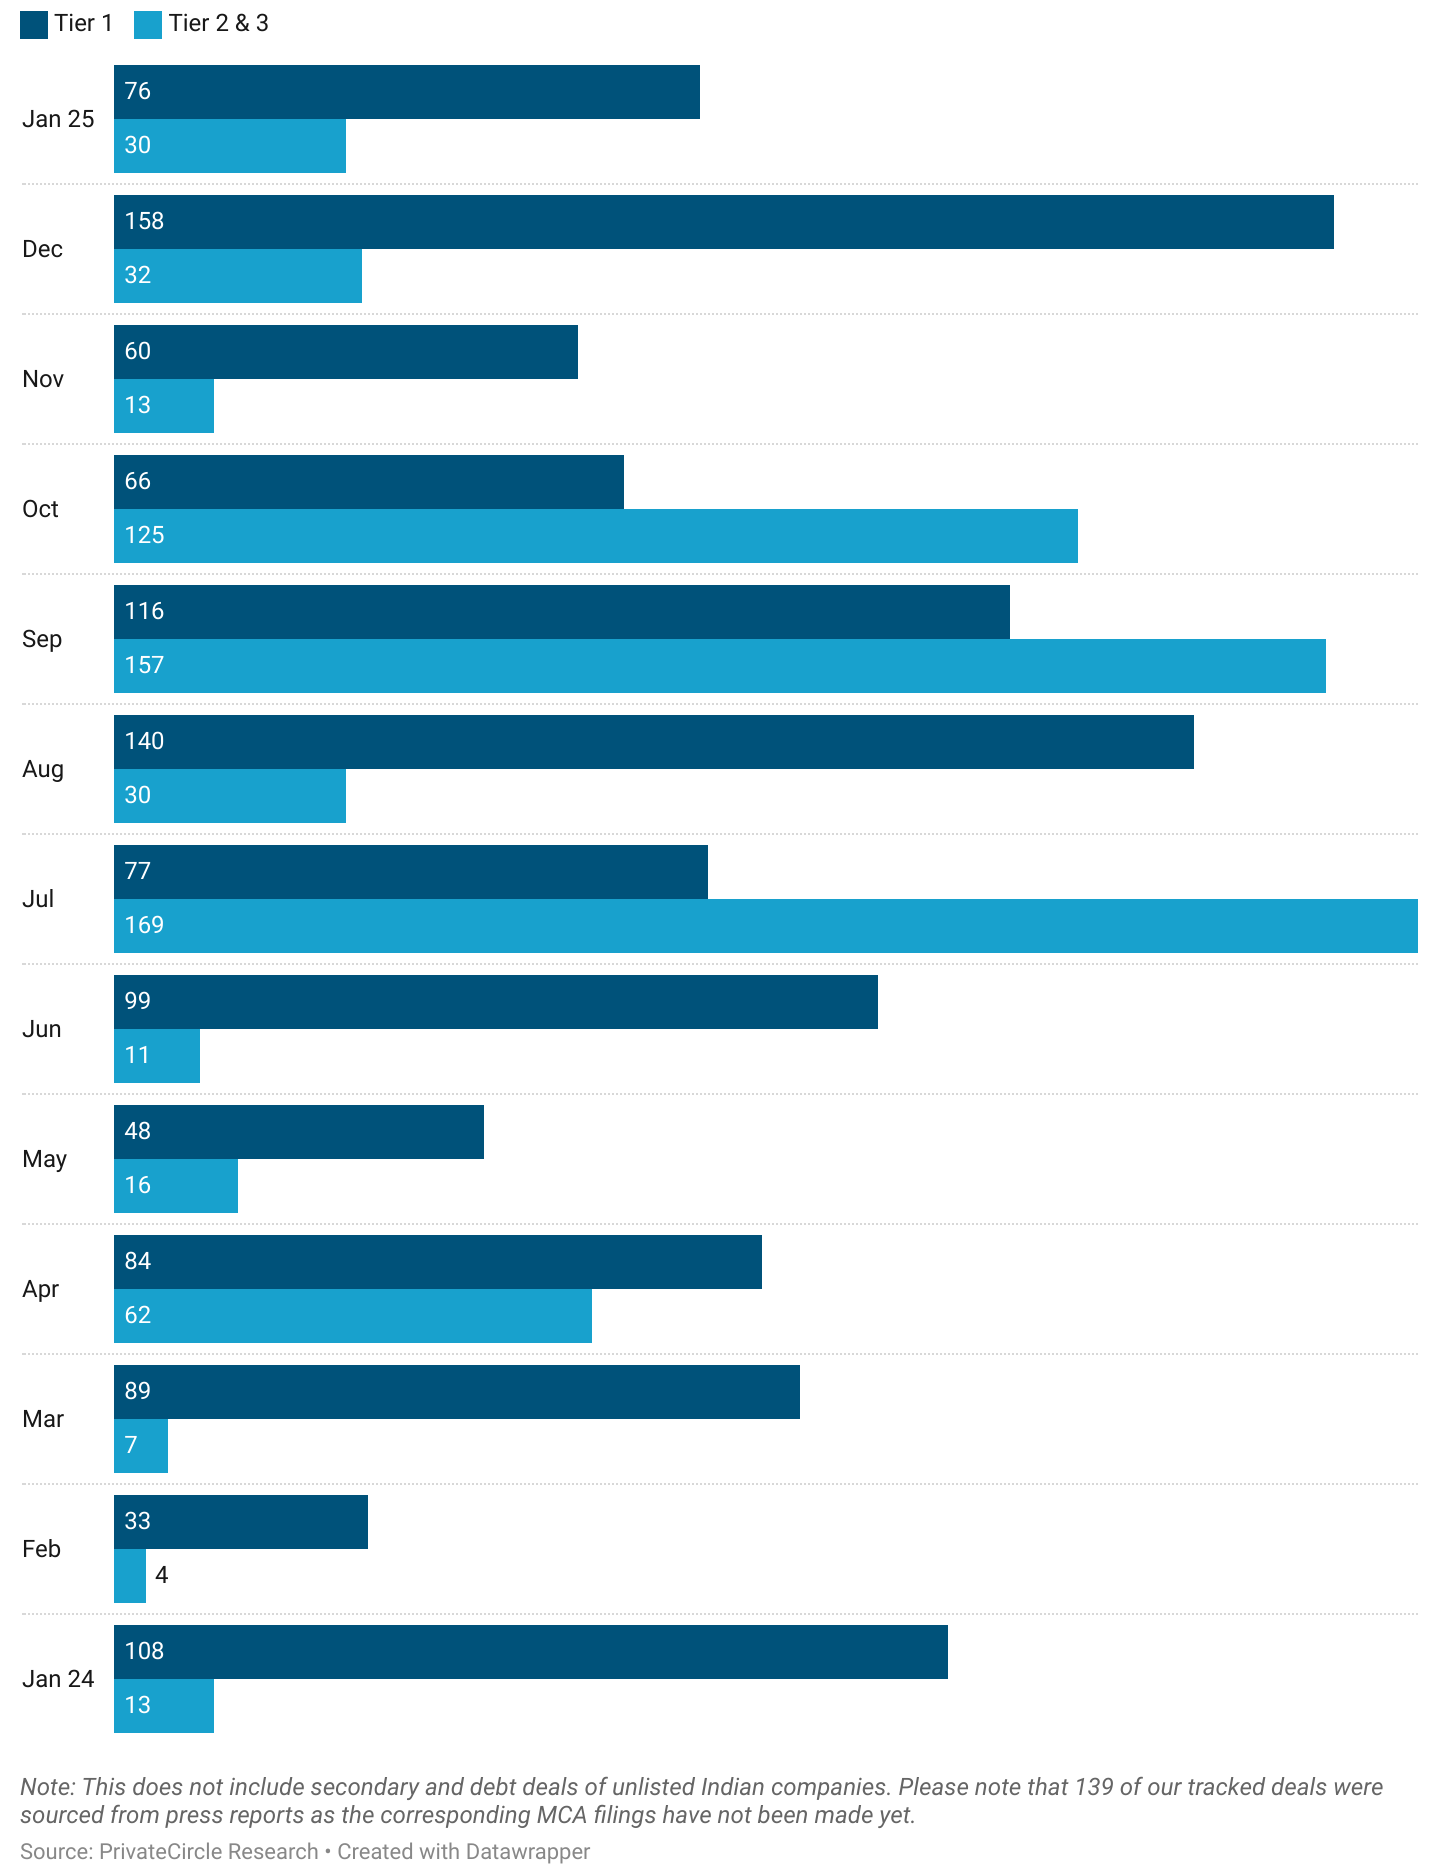
This pattern continues to highlight the high concentration of larger, high-growth startups in cities like Bengaluru and Mumbai, while Tier 2 & 3 cities are still catching up in terms of deal size.
Investor Type by City Tier – VC/PE Lead in Tier 1
In terms of investor type by city tier, VC/PE firms were the dominant players in Tier 1 cities, with 70 deals. In comparison, Tier 2 & 3 cities saw only 18 deals from VC/PE investors.
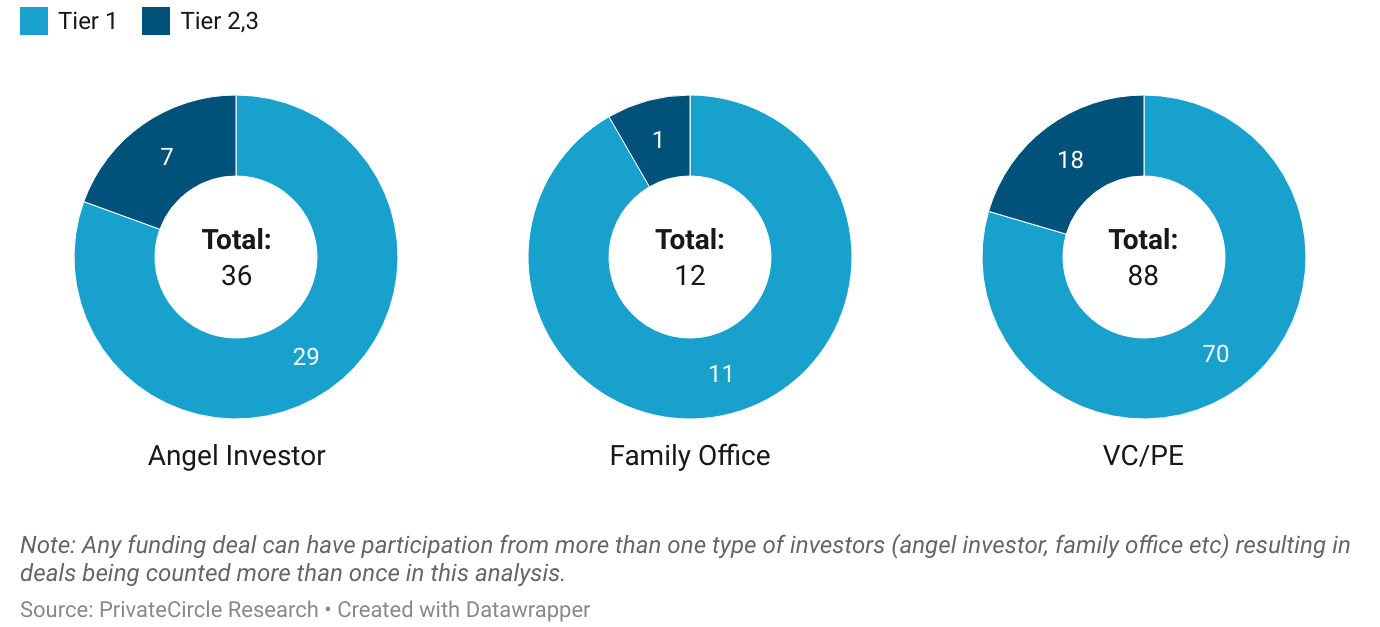
Angel investors were also more prominent in Tier 1 cities, suggesting that there’s a greater appetite for risk and higher returns in these urban centers.
Conclusion:
January 2025 has set the tone for another exciting year in India’s Private Markets.
With strong funding numbers, continued investor confidence, and the growing participation from Tier 2 and 3 cities, we can expect even more innovation to emerge from places like Jaipur and Indore.
While Tier 1 cities remain the focus for larger deals, there’s a growing shift in the ecosystem toward expanding horizons and tapping into new potential.
Stay tuned for more in-depth analyses and insights on the top private market deals, brought to you by PrivateCircle Research.

Follow us on social media for latest updates and insights into the dynamic landscape of Indian Private Markets.
Sign up on PrivateCircle Research to access data and insights on all things India Private Markets.