Skip to content
PrivateCircle Blog
Menu
  • Home
  • Research
  • Tech
  • Growth
    • Deals
  • Reports
  • About
Menu
Monthly Funding Recap: March 2025

Monthly Funding Recap India: March 2025

April 3, 2025April 3, 2025

The Indian private markets witnessed a dynamic funding landscape in March 2025.

With a total of ₹9,916 crore raised across 113 deals, the month saw a mix of large-scale investments, shifts in investor behavior, and a surprising surge in Tier 2 & 3 city funding.

Here’s a comprehensive breakdown of the key trends shaping private market investments this month.


Which Cities Got the Most Funding?

The usual suspects – Delhi NCR, Bengaluru, and Mumbai – continued to dominate private market deal activity, collectively raising over ₹6,500 crore across 84 deals.

Title - March 2025: City-Wise Deals

Description - Delhi NCR, Bengaluru, and Mumbai dominate the Indian private market landscape, collectively accounting for over ₹6,500 crore in valuation across 84 companies. Smaller cities like Paonta and Jaipur also contribute, showcasing the widespread reach of entrepreneurial activity.

Additional Notes: 
Tier 1 cities: Bangalore, Chennai, Delhi (Gurugram, Noida, Ghaziabad), Hyderabad, Kolkata, Mumbai(Thane), Pune, and Ahmedabad.

Tier 2,3 - rest all cities

https://datawrapper.dwcdn.net/EKVG4/1/
Click on the graph to access the responsive iframe. You can also zoom in on the map, embed the graph, download the data, or the image.
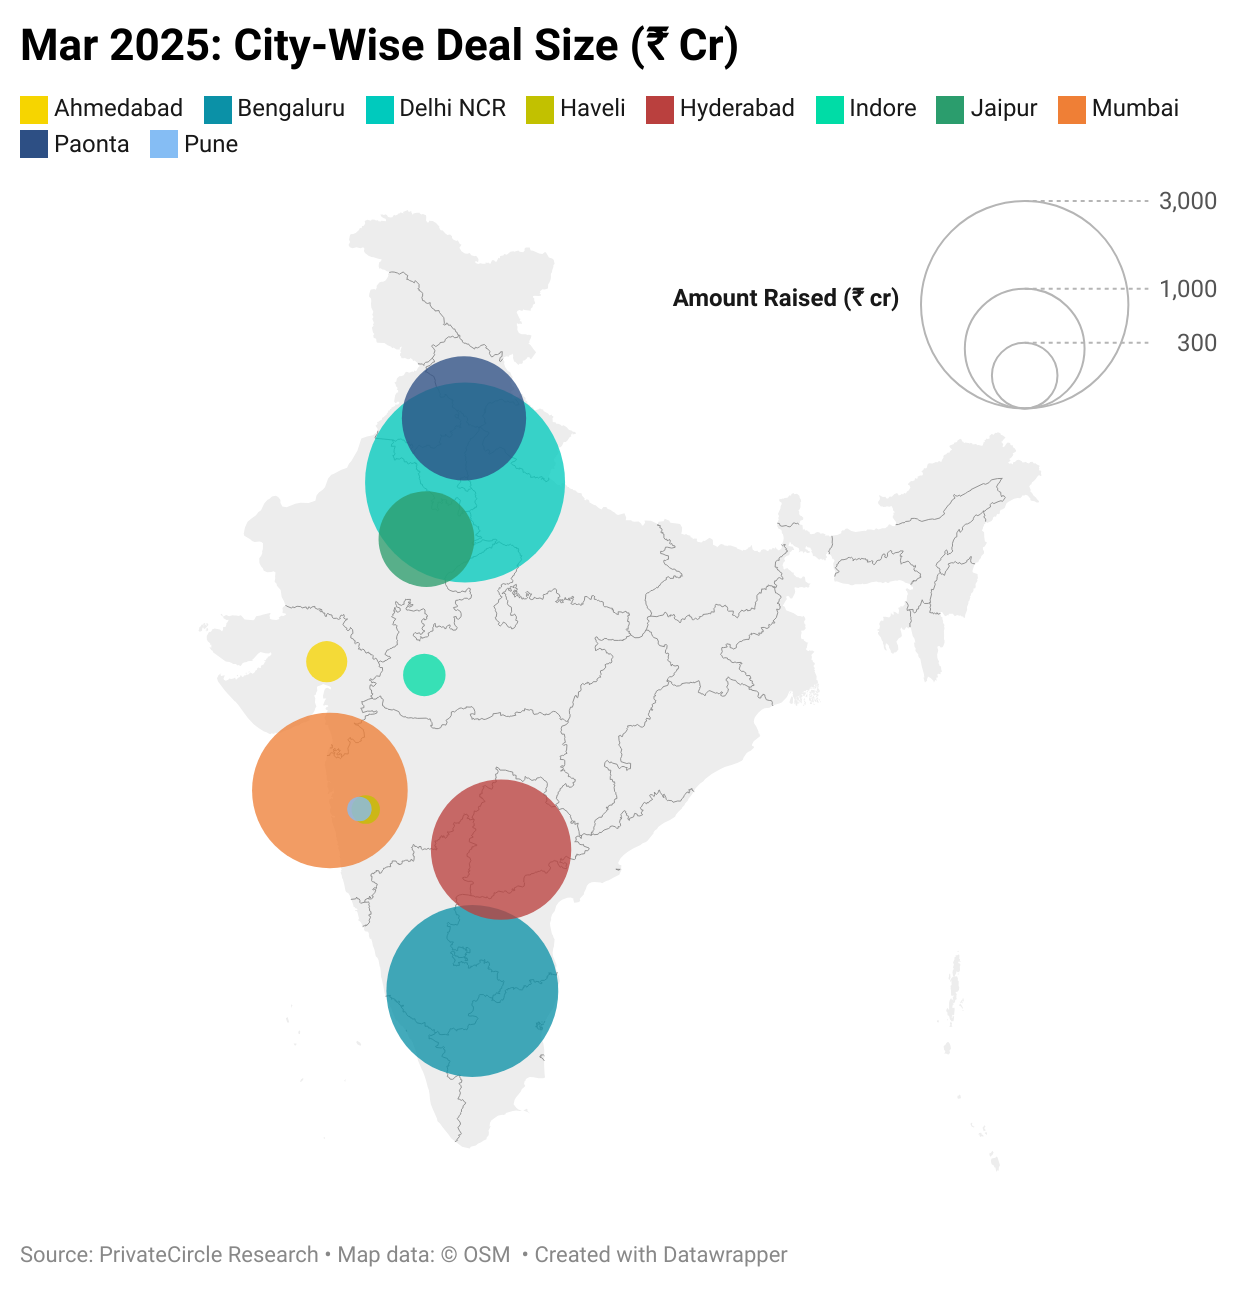
  • Delhi NCR led with ₹2,790.04 crore raised across 37 deals.
  • Bengaluru followed with ₹2,047 crore across 28 deals.
  • Mumbai secured ₹1,670 crore across 19 deals.
  • Other notable cities included Hyderabad (₹1,351 crore), Paonta (₹1,050 crore), and Jaipur (₹611.52 crore).
  • Smaller cities like Indore, Ahmedabad, Haveli, and Pune also contributed, reflecting the broadening reach of venture capital in India.

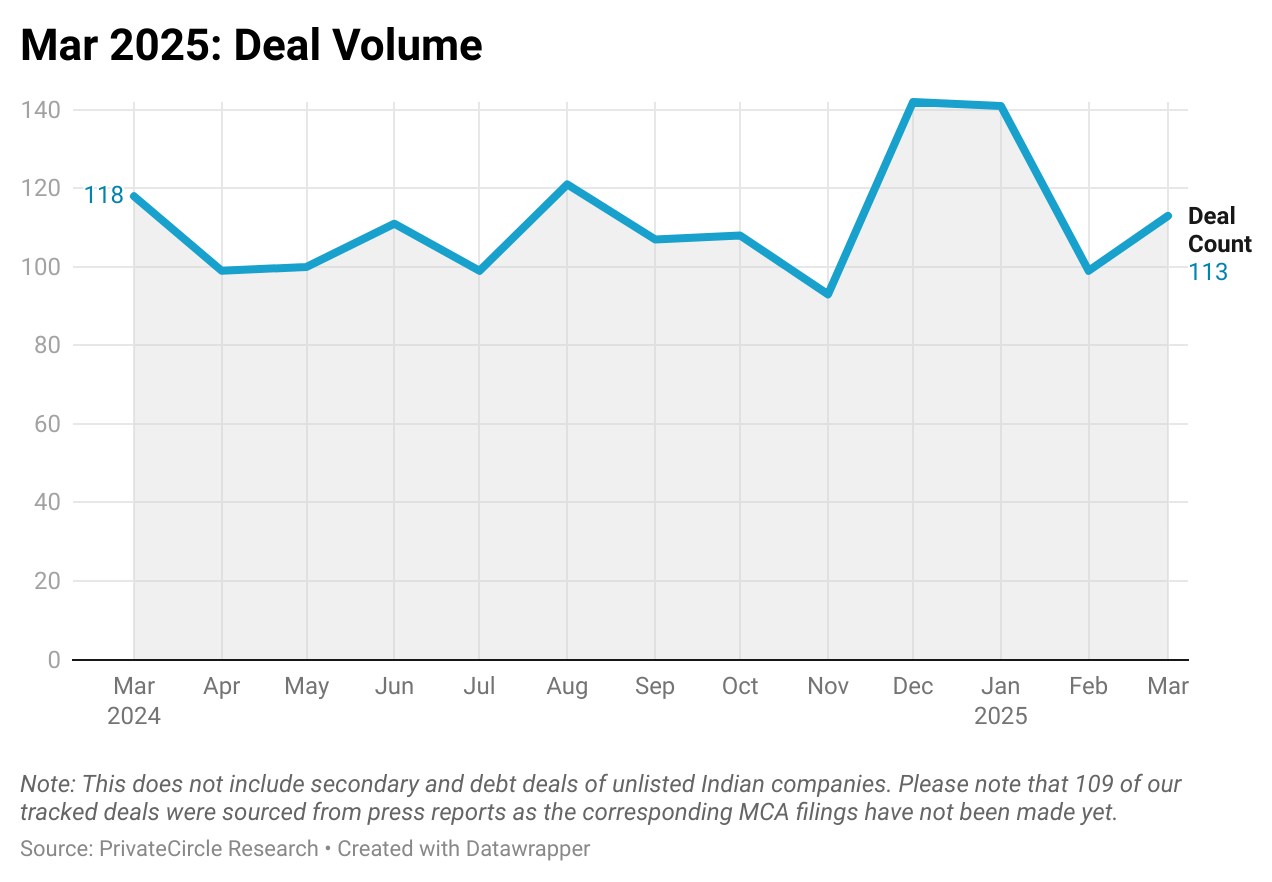
How Many Deals Happened?

A total of 113 deals were closed in March 2025, reflecting a 4.2% decline from 118 deals in March 2024 but a 14.9% increase month-over-month from February 2025’s 99 deals.

Title - March 2025: Deal Volume
Description - March 2025 recorded 113 deals, reflecting a 4.2% decline year-over-year from 118 deals in March 2024 and a 14.9% increase month-over-month from 99 deals in February 2025.

Note: This does not include secondary and debt deals of unlisted Indian companies. Please note that 109 of our tracked deals were sourced from press reports as the corresponding MCA filings have not been made yet. 

https://datawrapper.dwcdn.net/1TrcL/2/
Click on the graph to access the responsive iframe. You can embed it or download the data or download the image.

Biggest Funding Deals in March 2025

This month saw some major funding rounds, with three deals exceeding ₹1,000 crore:

Title - March 2025: Top 3 Deals (₹ cr)
Description - Darwinbox led the funding charts with ₹1,218.84 crore raised, followed closely by ONGC Green at ₹1,200 crore and Tirupati Medicare at ₹1,050 crore.

Note: This does not include secondary and debt deals of unlisted Indian companies. Please note that 109 of our tracked deals were sourced from press reports as the corresponding MCA filings have not been made yet. 

https://datawrapper.dwcdn.net/Q2r3f/1/
Click on the graph to access the responsive iframe. You can embed it or download the data or download the image.
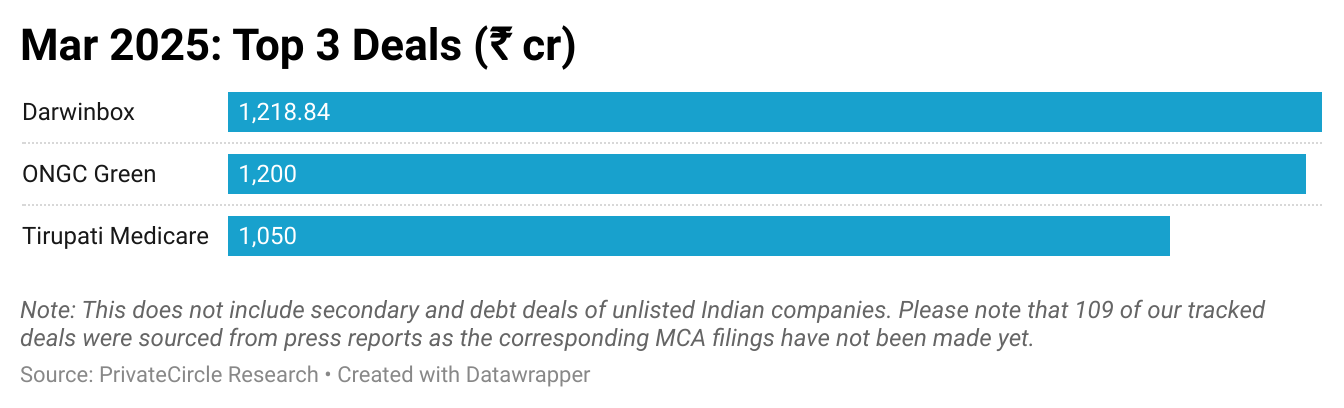
  1. Darwinbox – ₹1,218.84 crore
  2. ONGC Green – ₹1,200 crore
  3. Tirupati Medicare – ₹1,050 crore (A major Tier 2 city deal in Paonta)

These large deals highlight continued investor interest in enterprise tech, sustainability, and healthcare.

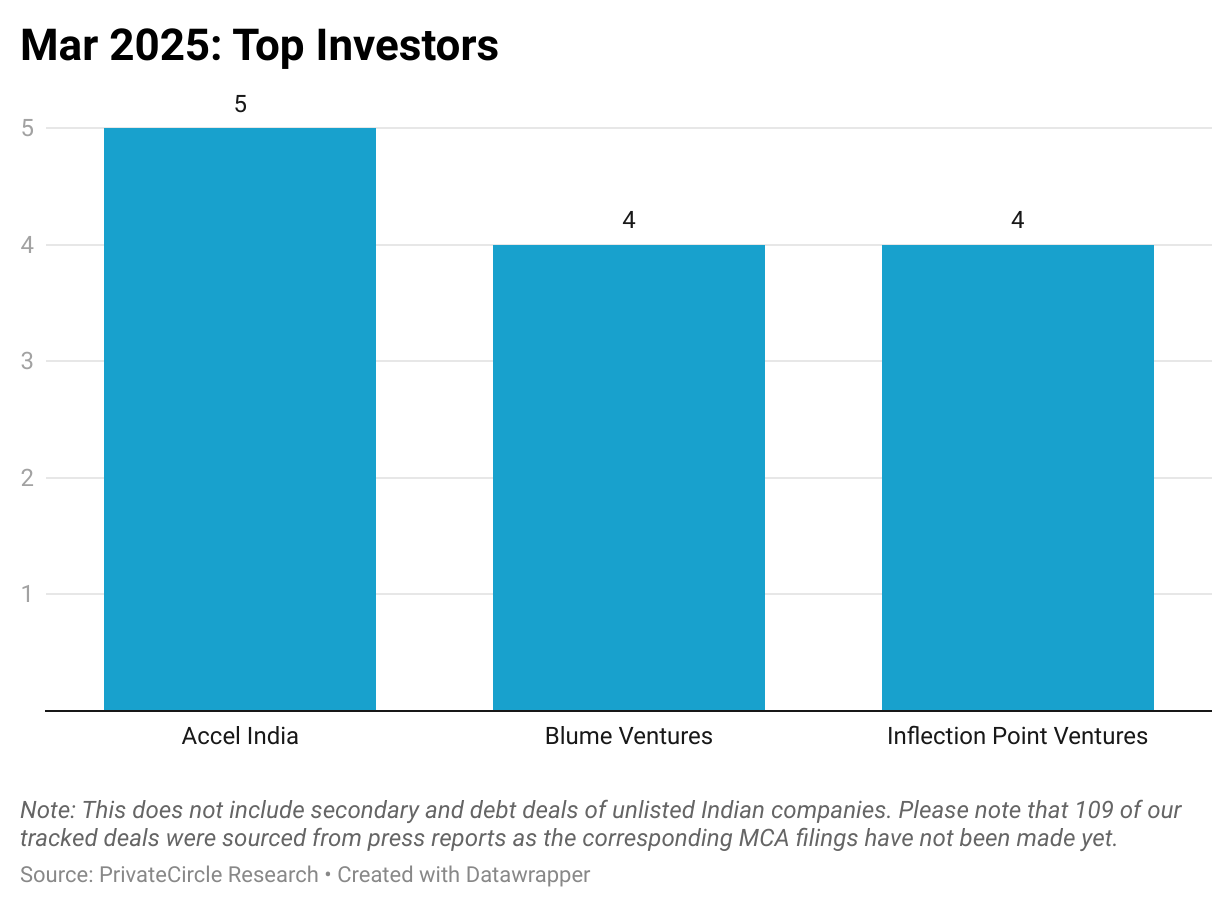
Who Invested the Most?

Accel India led March’s investment activity, closing 5 deals. Blume Ventures and Inflection Point Ventures followed closely with 4 deals each.

Title - March 2025: Top Investors
Description - Accel India led the deal activity with 5 investments, while Blume Ventures and Inflection Point Ventures followed closely with 4 deals each.

Note: This does not include secondary and debt deals of unlisted Indian companies. Please note that 109  of our tracked deals were sourced from press reports as the corresponding MCA filings have not been made yet. 

https://datawrapper.dwcdn.net/xhI3s/1/
Click on the graph to access the responsive iframe. You can embed it or download the data or download the image.

Investor Type Deal Volume

Venture Capital and Private Equity firms dominated deal activity in March 2025, recording 76 investments, a sharp rise from 51 in February 2025.

Title - March 2025: Investor Type Deal Volume
Description - Venture Capital and Private Equity firms drove deal activity in March 2025 with 76 investments, up from 51 in February 2025. Angel investor participation dropped to 24 deals from 29 in the previous month, while family offices saw a slight increase with 6 deals compared to 5 in February 2025.

Note: Any funding deal can have participation from more than one type of investors (angel investor, family office etc) resulting in deals being counted more than once in this analysis.

https://datawrapper.dwcdn.net/7q13z/1/
Click on the graph to access the responsive iframe. You can embed it or download the data or download the image.

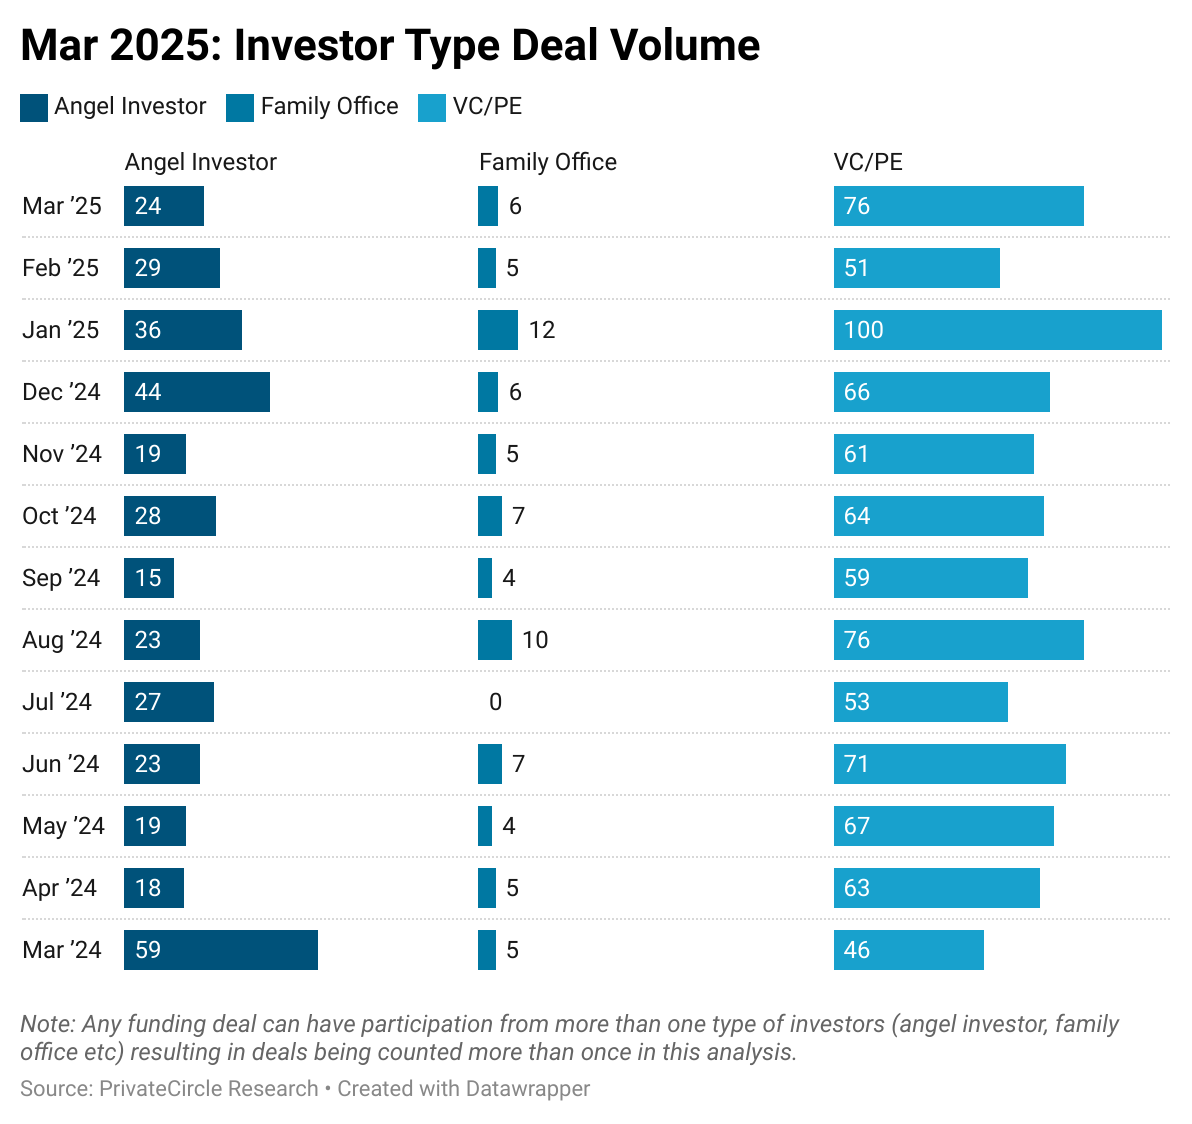
Angel investor participation dropped slightly to 24 deals from 29 in February, indicating a shift in early-stage funding dynamics. Family offices, however, saw a modest increase, contributing 6 deals, up from 5 in February.

Tier 1 vs. Tier 2 & 3 Cities

Tier 1 cities (Delhi NCR, Mumbai, Bengaluru, Hyderabad, Chennai, Pune, Kolkata, Ahmedabad) dominated funding but saw a notable decline:

Title - March 2025: Funding Across Tier 1, 2 & 3 Cities (₹ Cr)
Description - Tier 1 cities dominated fundraising in March 2025 with ₹8,017 crore raised, though this marked an 18.3% decline from ₹9,817 crore in February 2025. Tier 2 & 3 cities saw a significant jump, raising ₹1,898.93 crore - up from ₹513 crore in the previous month. This spike in Tier 2,3 funding was largely driven by the ₹1050 crore deal of Tirupati Medicare Limited in Paonta.

Note: This does not include secondary and debt deals of unlisted Indian companies. Please note that 109 of our tracked deals were sourced from press reports as the corresponding MCA filings have not been made yet. 

https://datawrapper.dwcdn.net/ps63p/1/
Click on the graph to access the responsive iframe. You can embed it or download the data or download the image.
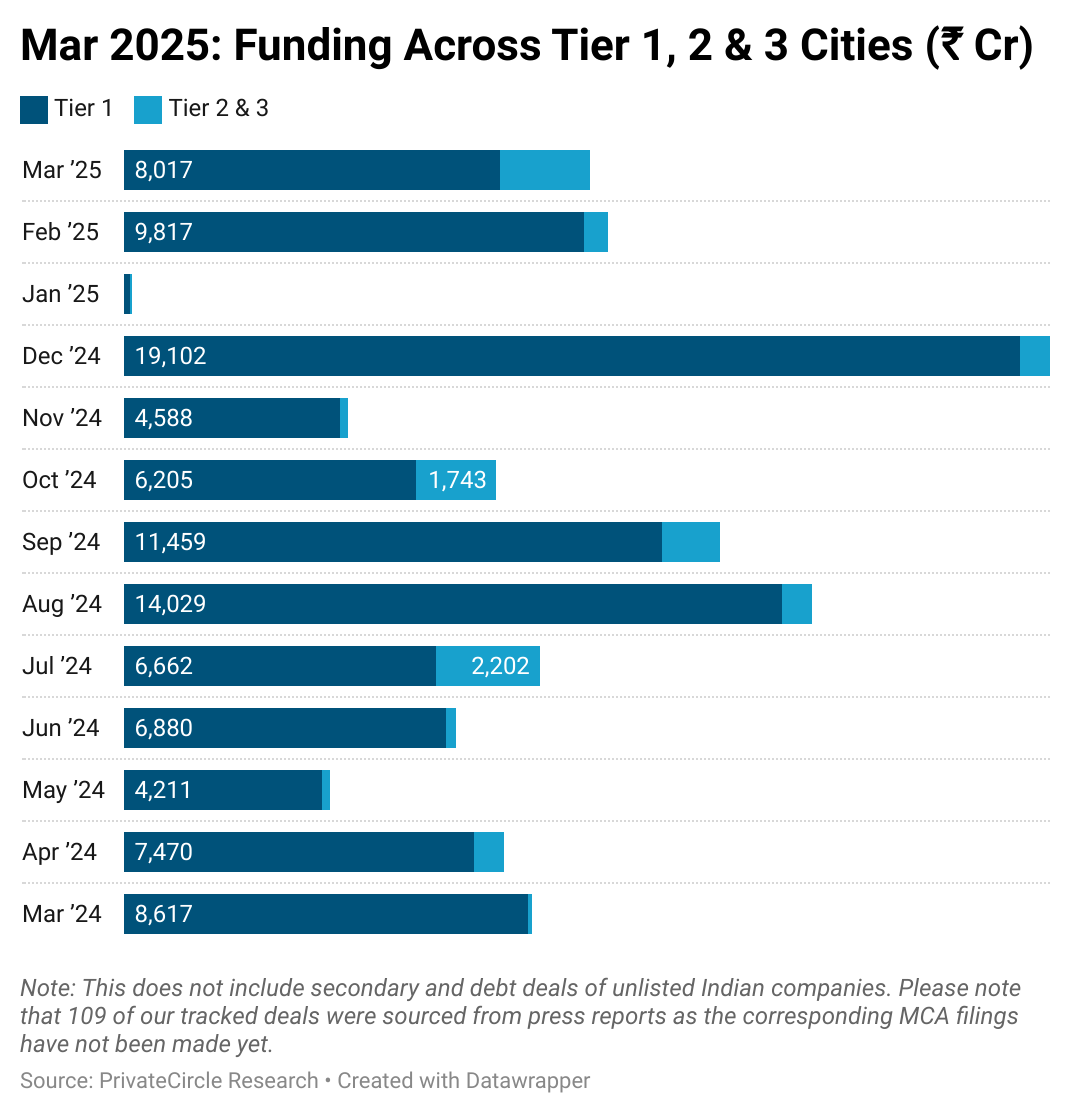
  • Tier 1 cities raised ₹8,017 crore, an 18.3% drop from ₹9,817 crore in February 2025.
  • Tier 2 & 3 cities surged to ₹1,898.93 crore, up from ₹513 crore in February, largely driven by Tirupati Medicare’s ₹1,050 crore round in Paonta.

Average Deal Size

The average deal size fluctuated across city tiers:

Title - March 2025: Avg. Deal Size for Tier 1-3 Cities (₹ Cr) 
Description - In March 2025, the average deal size in Tier 1 cities stood at ₹84 crore, reflecting a decline from ₹114 crore in February 2025. Meanwhile, Tier 2 & 3 cities saw a sharp rise, with the average deal size increasing to ₹112 crore from ₹39 crore in the previous month, largely driven by the ₹1050 crore deal of Tirupati Medicare Limited in Paonta.

Note: This does not include secondary and debt deals of unlisted Indian companies. Please note that 109 of our tracked deals were sourced from press reports as the corresponding MCA filings have not been made yet. 

https://datawrapper.dwcdn.net/8SP4h/1/
Click on the graph to access the responsive iframe. You can embed it or download the data or download the image.
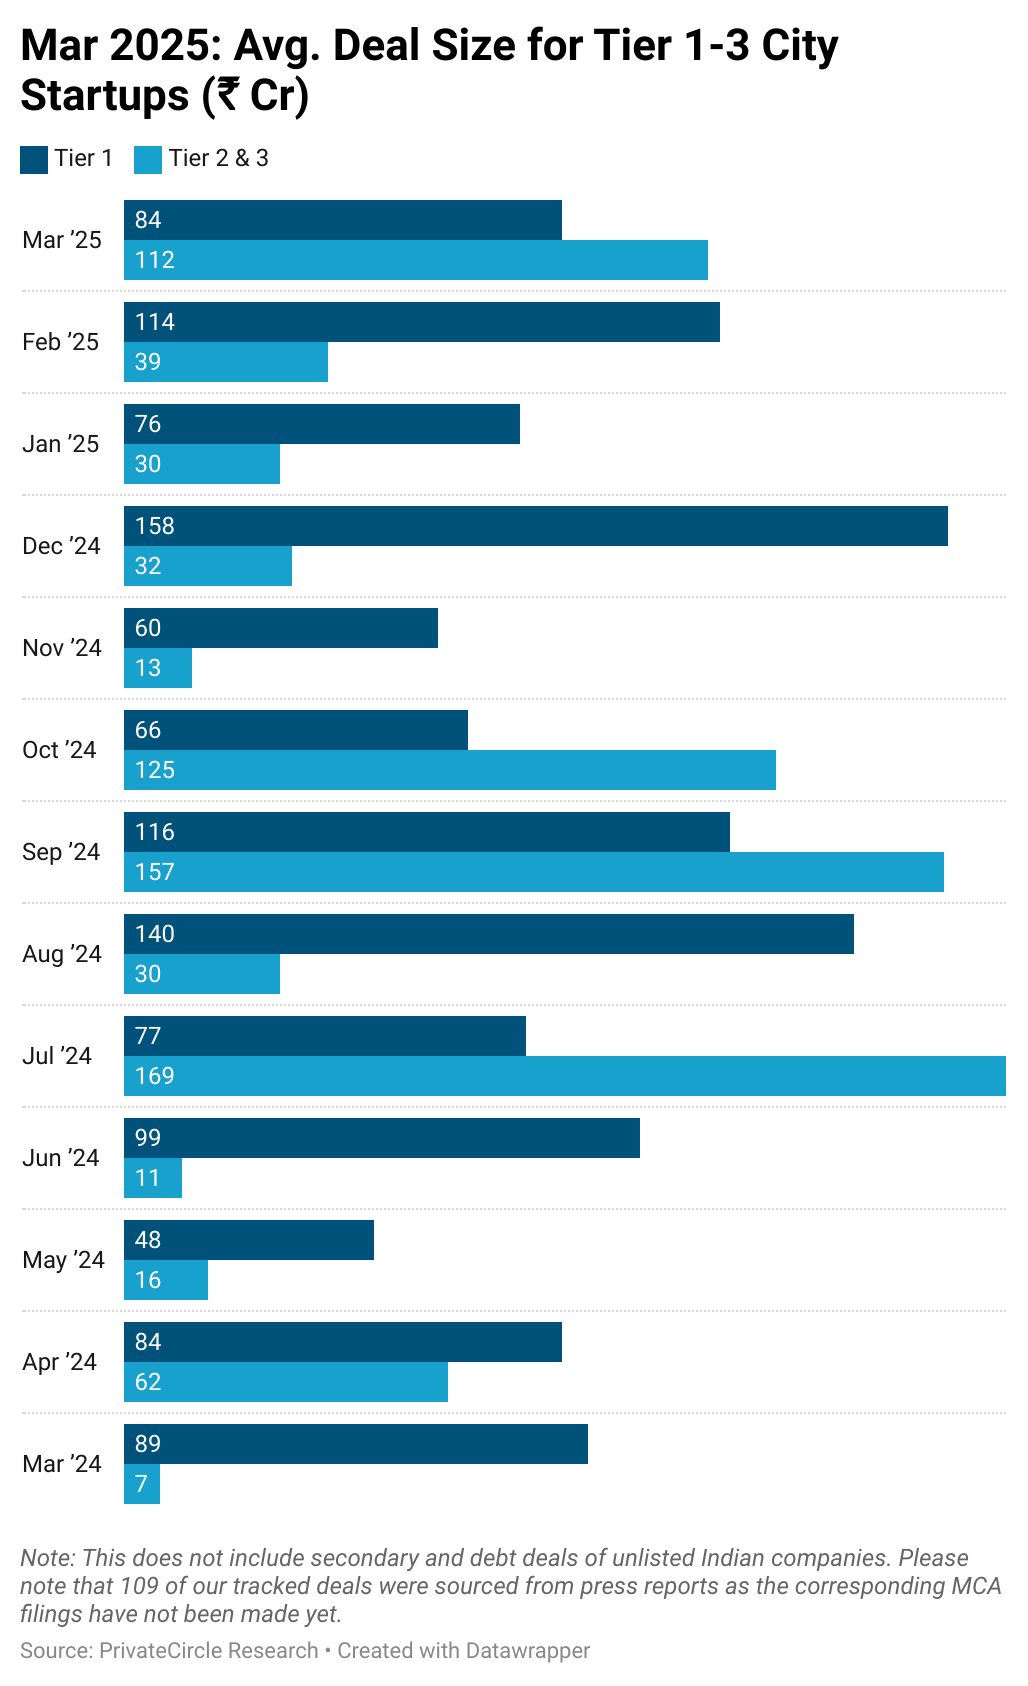
  • Tier 1 cities had an average deal size of ₹84 crore, down from ₹114 crore in February.
  • Tier 2 & 3 cities saw a dramatic rise to ₹112 crore from ₹39 crore, underscoring the growing confidence in smaller city-based companies.

Who’s Investing Where?

Investor behavior continued to show clear patterns across city tiers:

Title - March 2025: Investor Type by City Tier
Description - In March 2025, Venture Capital and Private Equity firms dominated investments across city tiers, with 64 deals in Tier 1 cities and 12 in Tier 2 & 3 cities. Angel investors were more active in Tier 1 cities with 18 deals, while Tier 2 & 3 cities saw 6 angel-led deals. Family offices remained exclusive to Tier 1 cities, contributing 6 deals.

Note: Any funding deal can have participation from more than one type of investors (angel investor, family office etc) resulting in deals being counted more than once in this analysis. 

https://datawrapper.dwcdn.net/GBwpf/1/
Click on the graph to access the responsive iframe. You can embed it or download the data or download the image.
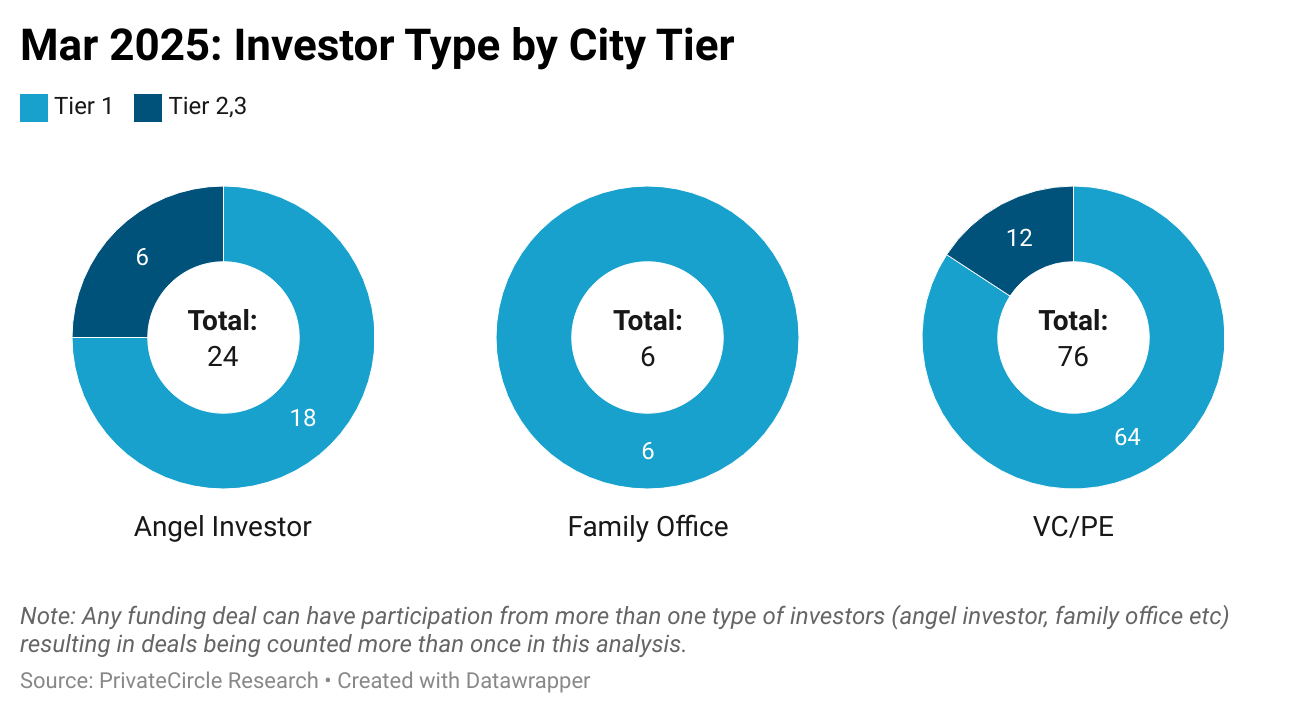
  • VC/PE firms dominated investments, leading 64 deals in Tier 1 cities and 12 in Tier 2 & 3 cities.
  • Angel investors closed 18 deals in Tier 1 cities, compared to 6 in smaller cities.
  • Family offices remained exclusive to Tier 1 cities, contributing 6 deals.

Conclusion

March 2025 reaffirmed key investment trends while introducing new dynamics:

  • Tier 1 cities continue to lead but face increasing competition from emerging hubs.
  • Tier 2 & 3 cities saw a record surge in funding, marking a shift in investor confidence.
  • Large-ticket deals remain a driving force, especially in enterprise SaaS, sustainability, and healthcare.

As we step into the next quarter, it will be crucial to watch if Tier 2 & 3 growth is a sustainable trend or a temporary spike driven by a few major deals. Stay tuned for more insights in the coming months!


Stay tuned for more in-depth analyses and insights on the top private market deals, brought to you by PrivateCircle Research.

India's Comprehensive Private Markets Intelligence Platform, PrivateCircle Research.
India’s Comprehensive Private Markets Intelligence Platform, PrivateCircle Research.

Follow us on social media for latest updates and insights into the dynamic landscape of Indian Private Markets.

Linkedin X.com

Sign up on PrivateCircle Research to access data and insights on all things India Private Markets.

Explore Previous Funding Recaps:

Startup Funding Recap: December 2024

Startup Funding Recap: January 2025

Startup Funding Recap: February 2025

Leave a Reply Cancel reply

Your email address will not be published. Required fields are marked *

Unlock the Power of Private Market Research

Reach right prospects and decision makers

Re-imagining Private Market Transactions

© 2025 PrivateCircle Blog | Powered by Minimalist Blog WordPress Theme