Explore the latest trends in startup funding across Indian cities in our new report. Dive into the data and discover what’s driving innovation in March 2024.
City-Wise Funding in March 2024
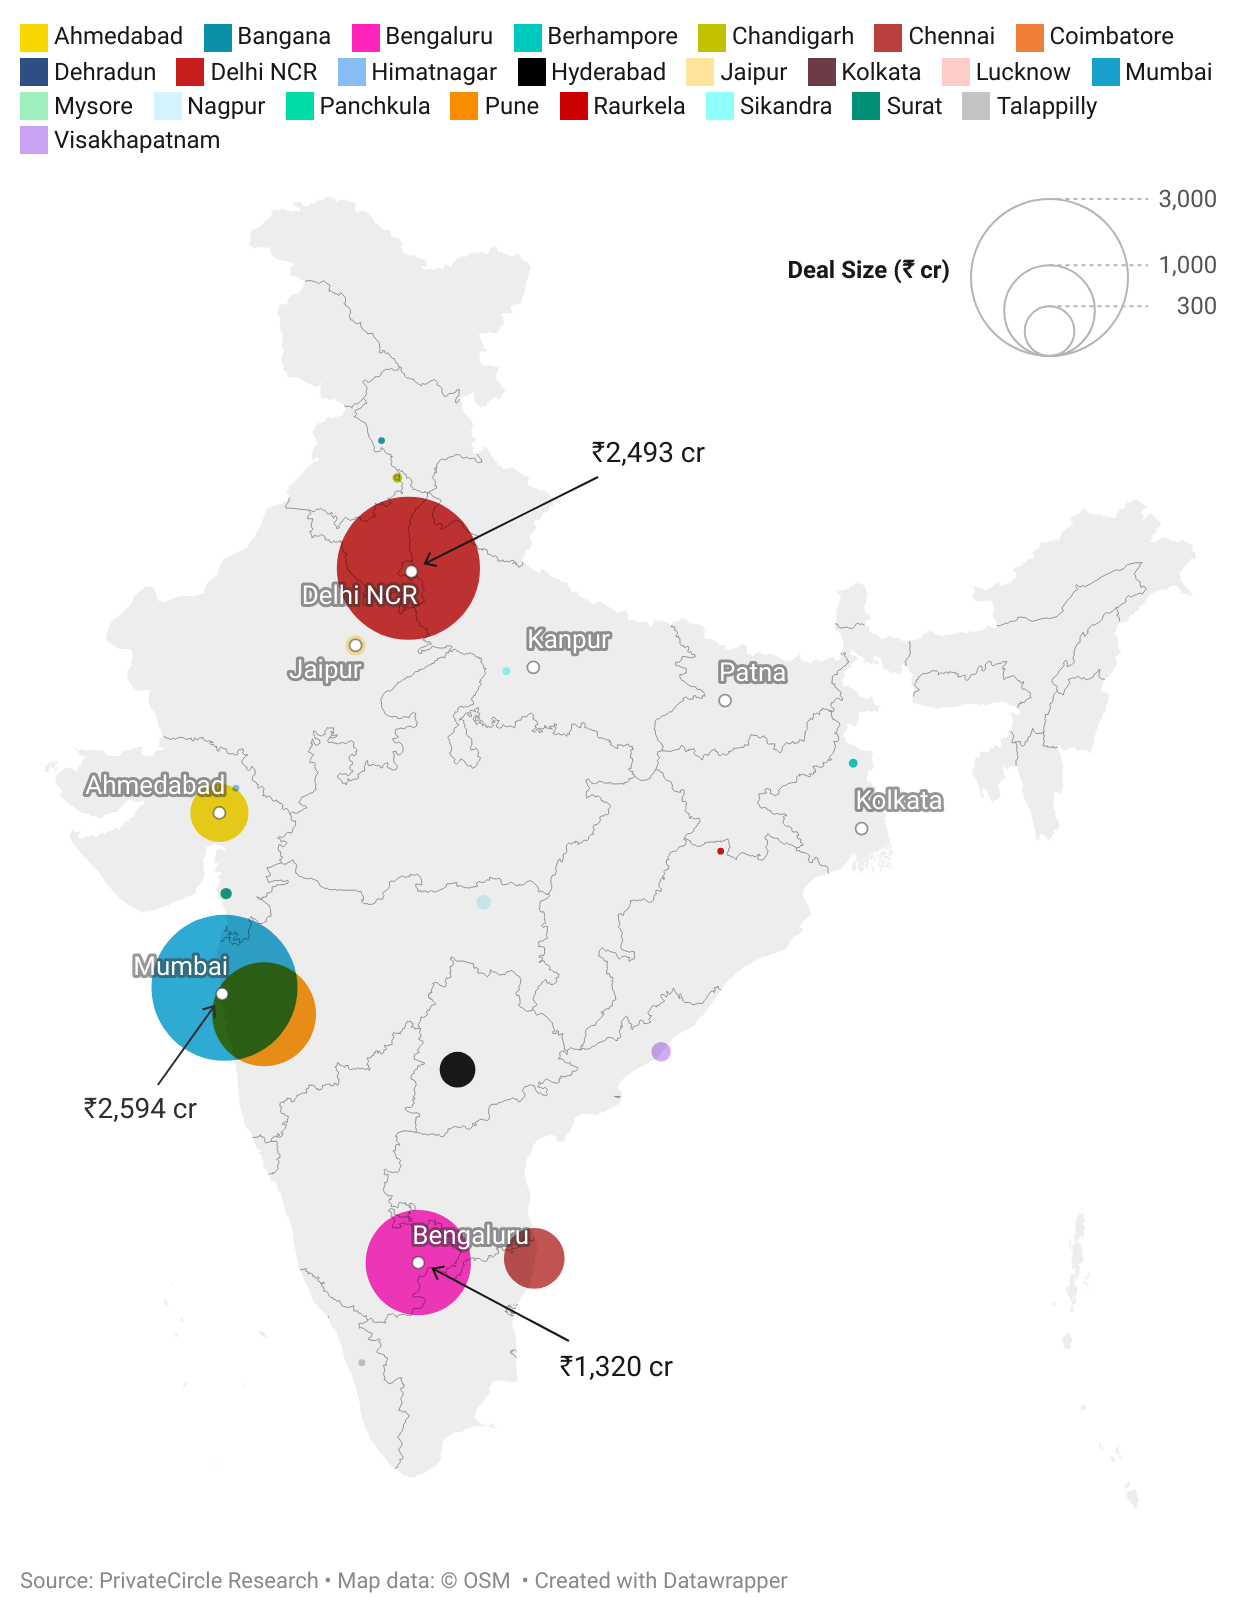
Mumbai, Delhi NCR, and Bengaluru emerged as the triumphant trio in March 2024, leading in total funding raised.
| City | Total Funding (₹ cr) |
| Mumbai | 2594 |
| Delhi NCR | 2493 |
| Bengaluru | 1320 |
| Pune | 1284 |
| Chennai | 414 |
| Ahmedabad | 379 |
| Hyderabad | 130 |
| Jaipur | 34 |
| Visakhapatnam | 31 |
| Nagpur | 14 |
| Surat | 7 |
| Chandigarh | 4 |
| Kolkata | 4 |
| Berhampore | 3 |
| Sikandra | 2 |
| Talappilly | 1 |
| Himatnagar | 1 |
| Raurkela | 1 |
| Bangana | 1 |
Investor-Wise Deal Volume in Tier 1 & Tier 2, 3 Cities
While tier 1 cities stole the spotlight, tier 2 and 3 cities carved their niche with a notable share of angel rounds.
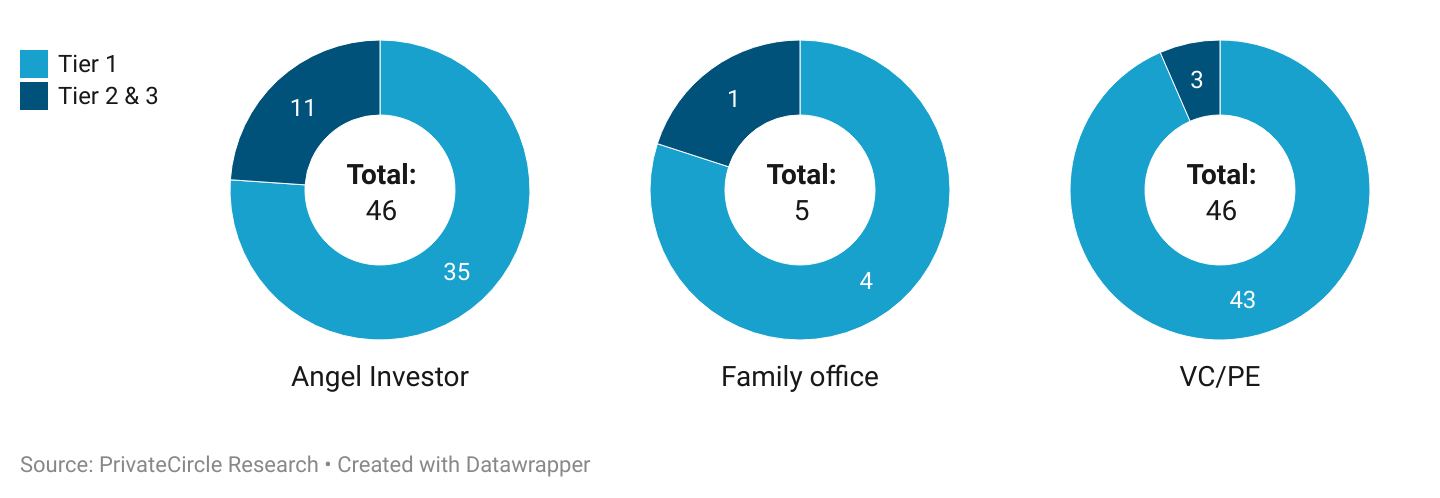
In March 2024, 24% (11) angel rounds happened in tier 2, 3 city startups. In comparison, only 3 VC/PE deals happened in tier 2, 3 city startups and one family office deal.
Average Deal Size for Tier 1 & Tier 2, 3 City Startups
When it comes to deal size, tier 1 cities emerged as the heavyweight champions, towering over their tier 2 and 3 counterparts.
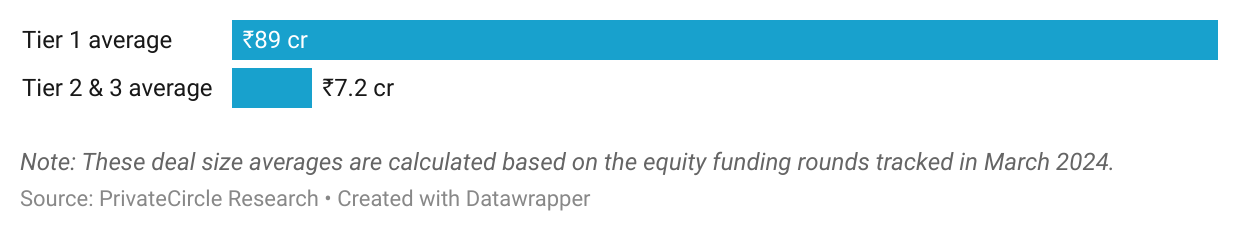
Average deal size for tier 1 city startups was almost 12x of tier 2 & 3 city startups.
| City | Average Deal Size (₹ cr) |
| Mumbai | 170.89 |
| Delhi NCR | 73.709 |
| Bengaluru | 63.466 |
| Pune | 160.541 |
| Chennai | 414.25 |
| Ahmedabad | 126.417 |
| Hyderabad | 32.394 |
| Jaipur | 16.84 |
| Visakhapatnam | 31 |
| Nagpur | 14 |
| Surat | 7 |
| Chandigarh | 4.144 |
| Kolkata | 3.5 |
| Berhampore | 4 |
| Sikandra | 1.75 |
| Talappilly | 1 |
| Himatnagar | 0.836 |
| Raurkela | 0.8 |
| Bangana | 0.75 |
| Coimbatore | 0.4 |
| Lucknow | 0.35 |
| Dehradun | 0.1 |
Deal Value Split by Tier 1 & Tier 2, 3 Cities
While tier 1 cities commanded the lion’s share of funding, tier 2 and 3 cities showcased their resilience and potential with a commendable showing.
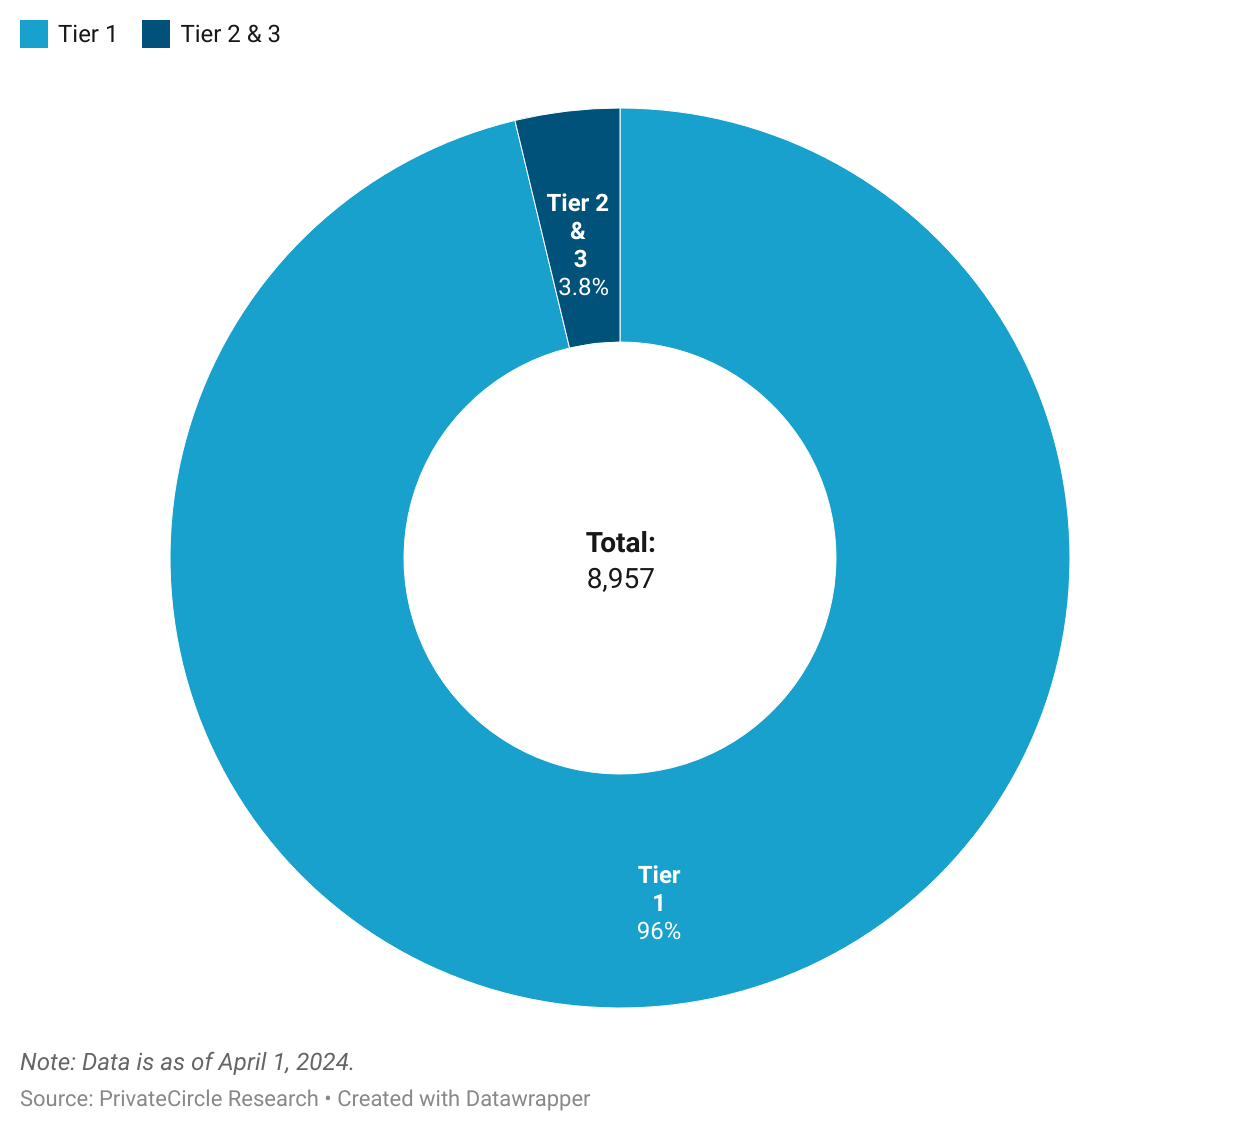
Almost 96% (₹8,621 cr) of the total funding raised in March 2024 went to tier 1 city startups as compared to ₹336 cr raised by tier 2 & 3 city startups.
In terms of deal count, 118 funding deals were recorded in March, out of which 99 were raised by tier 1 city startups.
At PrivateCircle, we’re dedicated to unraveling the intricacies of India’s private markets and empowering stakeholders with actionable insights.
Stay tuned for more in-depth analyses and exclusive reports as we continue to navigate the dynamic landscape of startup funding and innovation.

Follow us on social media for latest updates and insights into the dynamic landscape of Indian Private Markets.