Welcome to yet another It’s-a-big-deal blog. Today we explore the top private equity and venture capital deals happening in the Indian private markets over the span of 25 May – 17 June 2023 using PrivateCircle Research.
This is the blog version of our video series episode 6 that is available on Linkedin and YouTube.
Within the deal-book search criteria, we apply the date-filter and few more filters to view all the PE/VC deals. The list then will be sorted based on descending deal sizes.
Sorting them by deal size, we find that Cleanmax Enviro Energy Solutions has secured the largest funding deal. Brookfield Renewable (Operating) has invested approximately ₹3000 cr in Cleanmax to acquire a controlling stake. It’s worth noting that this funding consists of a mix of primary and secondary investments.

Cleanmax operates as a renewable energy company in the commercial and industrial sector. They boast an impressive portfolio of 1 GigaWatt of operating renewable assets, including large-scale wind and solar farms, as well as rooftop solar projects.

Their clientele spans across India, the UAE, and Thailand. In the latest reported financial year (FY22), Cleanmax generated revenues of ₹720 cr.
Growth and Financial Performance
Cleanmax has demonstrated robust growth over the past three financial years, rebounding from a year of negative growth in FY2019. Prior to that, the company consistently achieved high growth since its inception.
This sustained growth is reflected in their EBITDA (Earnings Before Interest, Taxes, Depreciation, and Amortization) figures, which have consistently remained between 40% and 60% over the past four years. Previously, EBITDA ranged from 10% to 20% during the initial five years. This indicates a conscious effort to improve profitability.
However, the picture is slightly different when we consider the Profit After Tax (PAT). PAT initially exhibited a high value, then experienced a dip, and has now stabilized at around 4%. It is possible that the higher PAT in the early years was influenced by deferred taxes resulting from a tax holiday availed during the initial years of operation.
Nevertheless, Cleanmax has consistently performed well, which likely contributed to the recent funding deal.
Revenue Sources and Asset Ownership
An intriguing observation from Cleanmax’s income statement is the evolution of their primary revenue source. Initially, they relied on the sale of goods and trading, but they have now transitioned to a predominantly services-based model.

When we examine their balance sheet, it becomes evident that their fixed assets are approximately four times their revenue. This indicates substantial asset ownership.
Cleanmax likely operates on a “Build, Own, Operate” model, where they own the energy assets and provide services to customers utilizing those assets, particularly in the domain of electricity generation.

Asset Turnover Ratio and Equity Ratio
Given Cleanmax’s significant asset ownership, it is pertinent to evaluate their Asset Turnover Ratio and Equity Ratio. The Asset Turnover Ratio represents total revenue or sales divided by total assets.

A higher asset turnover ratio indicates a company’s ability to generate greater revenue from its assets. On the other hand, the Equity Ratio is calculated by dividing total equity by total assets.

A higher equity ratio suggests that a company has primarily funded its assets using equity rather than taking on substantial debt, thereby reducing financial risk. Cleanmax’s advanced financial ratios can be seen on PrivateCircle Research when your package also includes detailed profile.
Cleanmax’s Asset Turnover Ratio stands at 0.22, while their Equity Ratio is 0.3. Neither ratio is particularly high. The relatively low Asset Turnover Ratio may be attributed to the longer lifecycle of assets such as solar power plants, which potentially leads to lower revenue realization relative to asset ownership.
A lower equity ratio suggests that Cleanmax relies more on debt, possibly in the form of Project Finance Debt, which is common in infrastructure projects utilizing the build, own, operate model.
To determine whether these ratios are low or acceptable within Cleanmax’s operating sector, it would be beneficial to compare them with those of their competitors.
Comparative Competitors Analysis
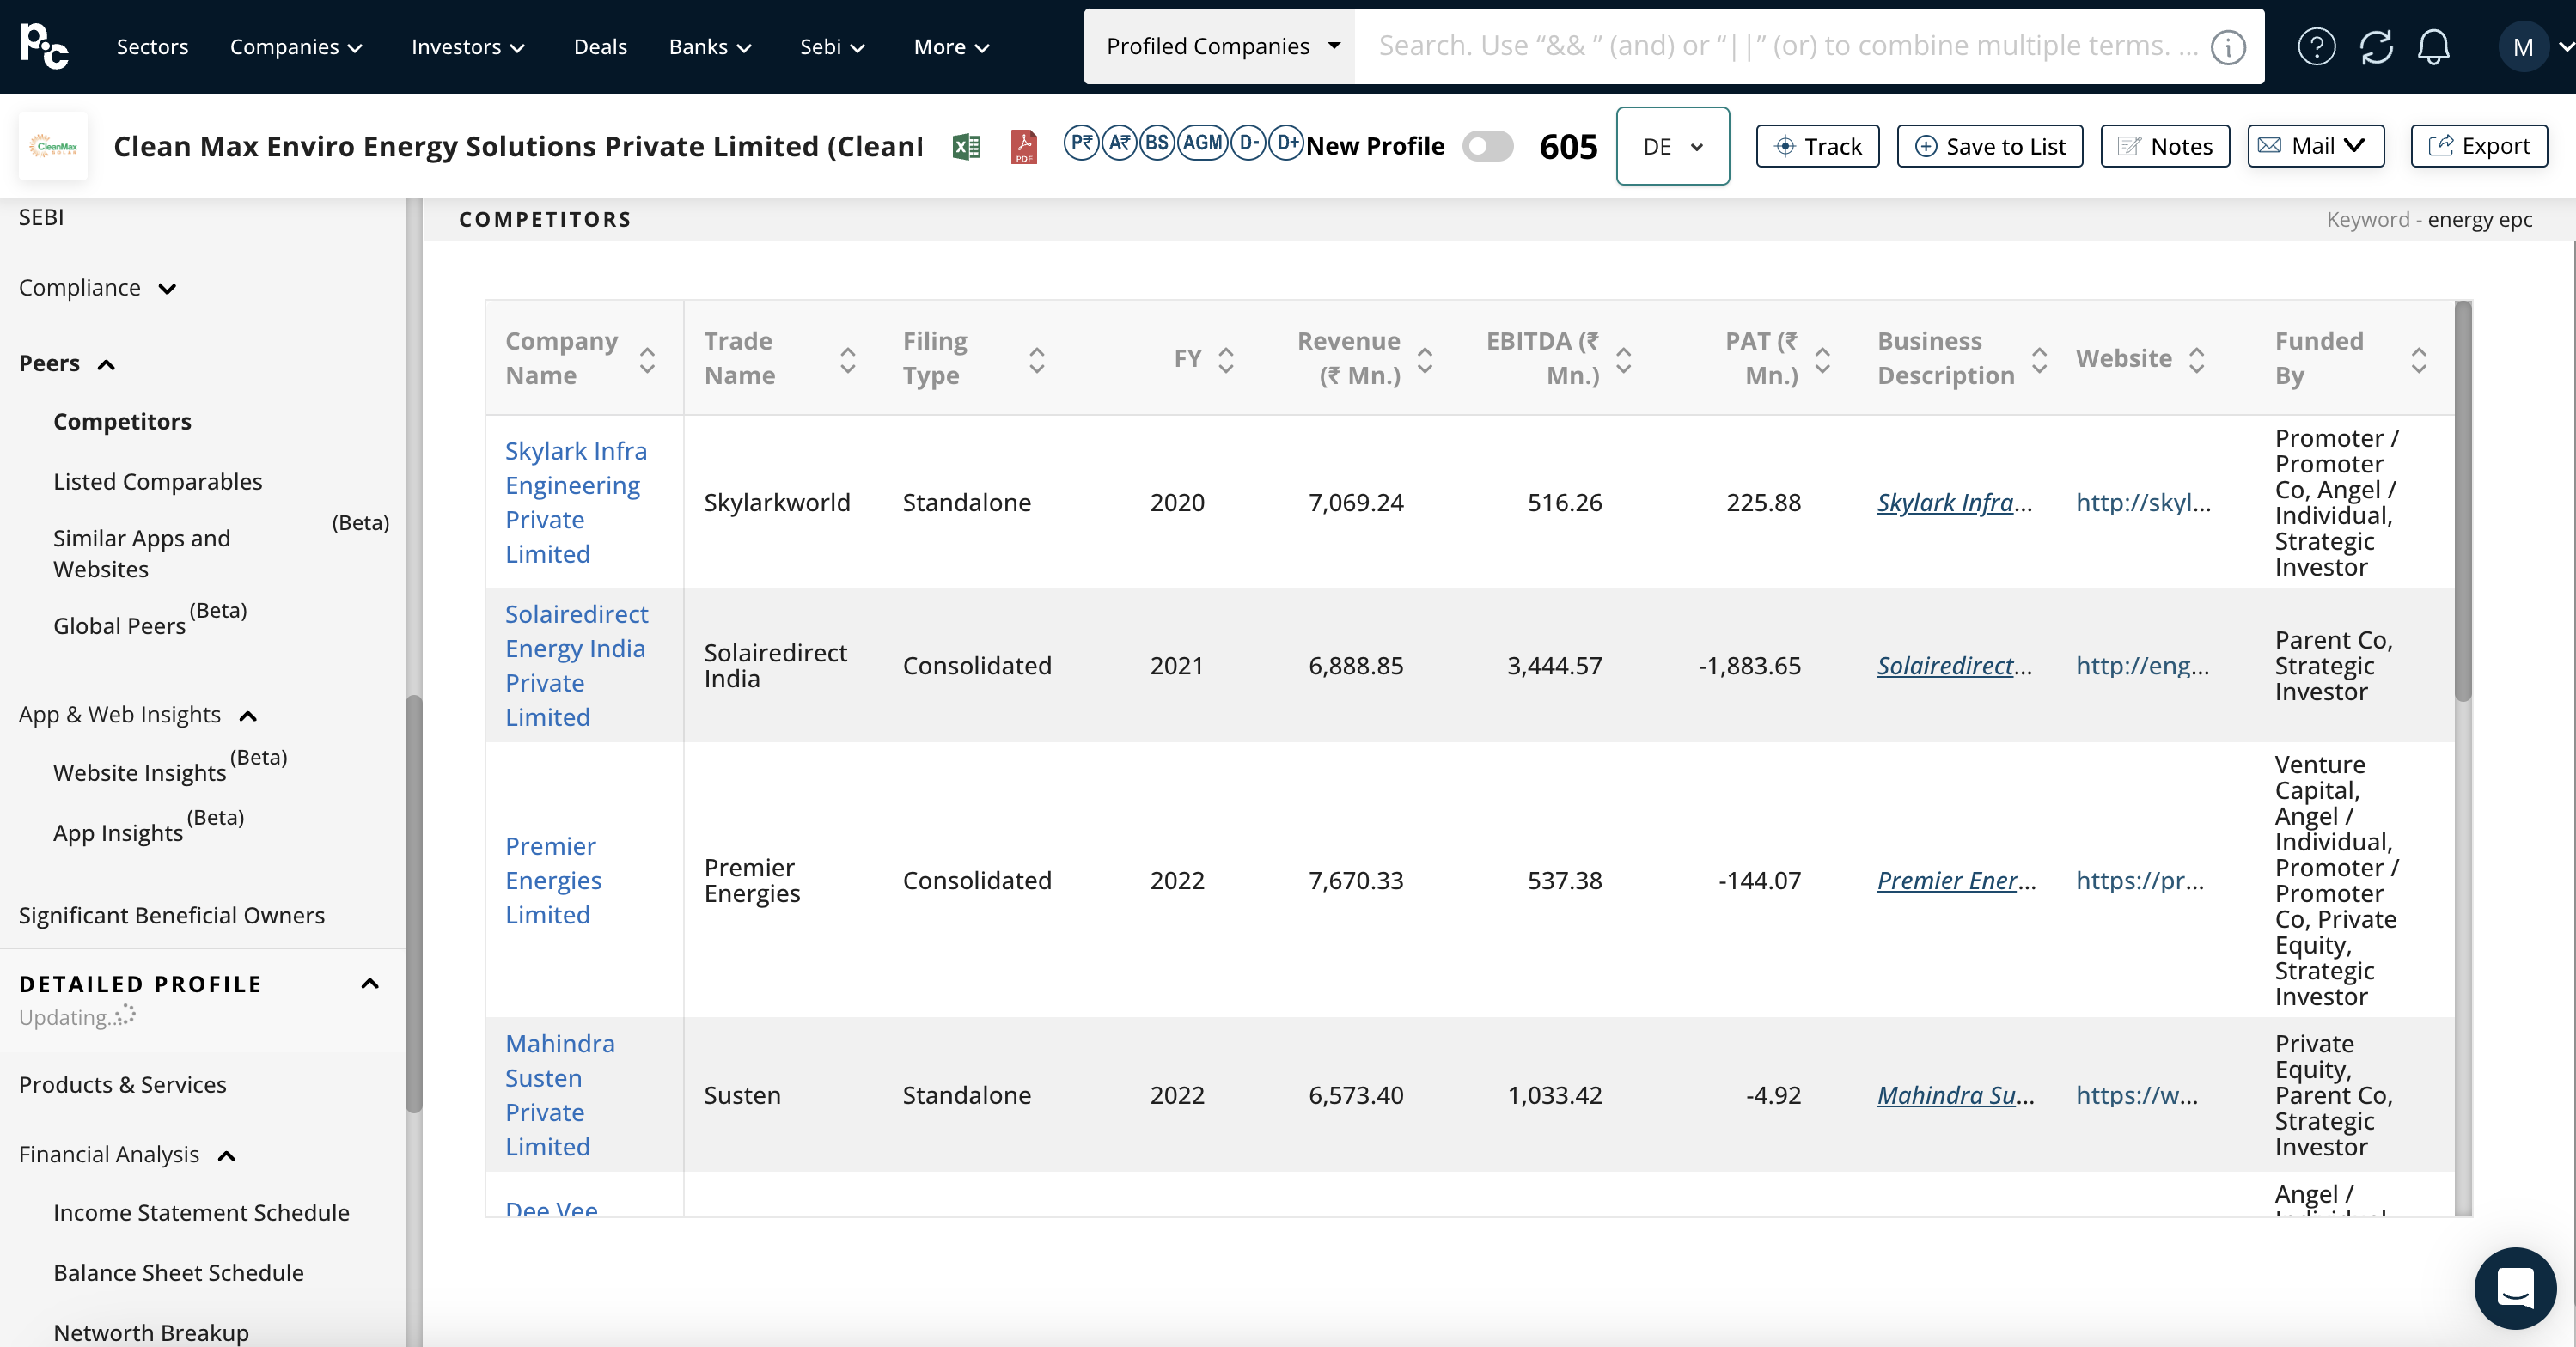
By accessing the peers tab on the PrivateCircle Research dashboard, we can compile a list of Cleanmax’s competitors for a comprehensive comparison.

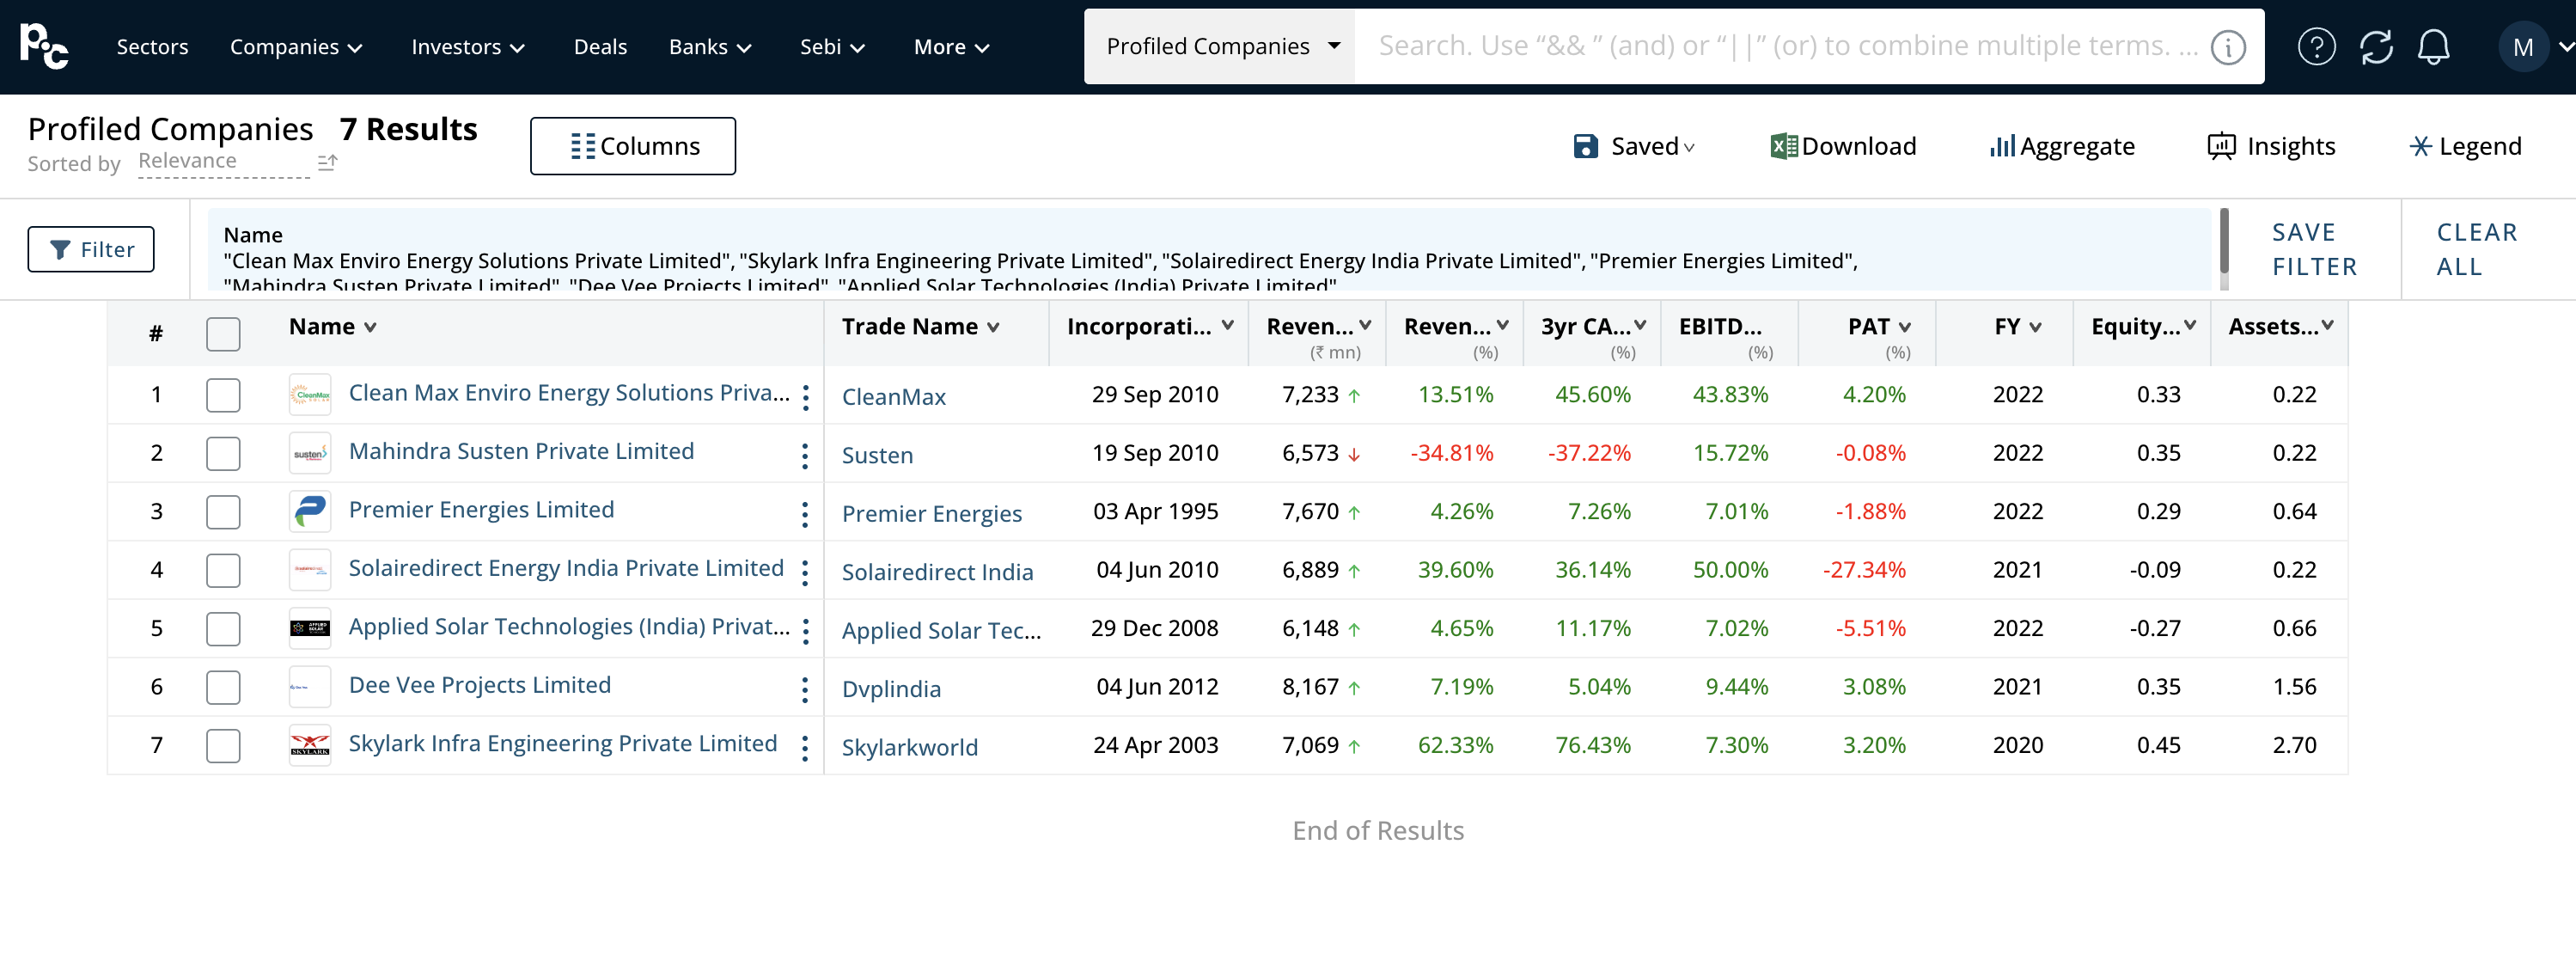
These companies generate revenue in the range of ₹600 to 800 cr. However, their profitability varies significantly, with some demonstrating high growth while others do not.

In terms of equity ratios, Cleanmax’s competitors exhibit ratios within a similar range, barring a few exceptions. The Asset Turnover Ratio varies from 0.2 (similar to Cleanmax) to as high as 2.7. This discrepancy may arise due to differing business models or the stage of development of each company.
To truly understand whether Cleanmax’s ratios are low or acceptable, it is essential to consider the sector-specific context within which the company operates.
Leveraging PrivateCircle Research Dashboard
Before concluding, let’s explore a fascinating feature available on the PrivateCircle research dashboard. In the Loans tab, we can find a comprehensive list of loans obtained by Cleanmax. Each loan entry provides details such as the lender’s name, charge ID, date, and amount. This generally becomes available when users opt-in for debt related intelligence including loans, charges, ratings etc.
Within these by clicking on the hyperlinks associated with specific charge IDs, we can access detailed information about each loan, including interest rates, repayment terms, and the collateral involved.

It’s worth noting that some charges lack additional details for the past year, possibly indicating missed filings by the company.
Wrapping Up the Big Deal
In conclusion, we have conducted a detailed analysis of Cleanmax Enviro Energy Solutions, the largest funding deal in recent weeks. We gained insights into their growth trajectory, financial performance, revenue sources, asset ownership, and various financial ratios. By comparing Cleanmax with its competitors, we were able to assess its position within the sector.
If you’re interested in exploring the Indian Private Markets and conducting your analysis, PrivateCircle Research is the best modern tool you can rely on for reliable and accurate data. You can enjoy a free trial and even schedule a product demo.
We welcome your feedback on this analysis, so please feel free to share your thoughts in the comments. Stay tuned for more insightful content, and thank you for reading!
Disclaimer: The content provided in this article is for educational and informational purposes only and does not constitute professional financial advice. The opinions expressed herein are those of the author and do not necessarily reflect the views of the company / organization.

Please consult a qualified financial professional prior to making any financial decisions.
Read more blogs of this series;
Epsiode 1 | 27 Feb – 05 Mar 2023
Episode 3 | 13 Mar -15 Apr 2023
Episode 4 | 16 Apr – 02 May 2023
Watch episodes of our ‘It’s a big deal’ series;
Epsiode 1 | 27 Feb – 05 Mar 2023
Episode 3 | 13 Mar -15 Apr 2023.


