Corporate borrowing remained a defining theme of India Inc’s financial landscape in 2025. As companies across sectors tapped debt markets to fund expansion, refinance balance sheets, and manage working capital, loan charge filings revealed clear sectoral patterns and cyclical shifts through the year.
This report presents a month-wise, industry-wise view of loan charges availed by Indian companies in 2025, offering insights into which sectors led borrowing activity, when leverage peaked, and what these trends signal for the broader corporate economy.
Industry Snapshot: Borrowing Leaders of 2025
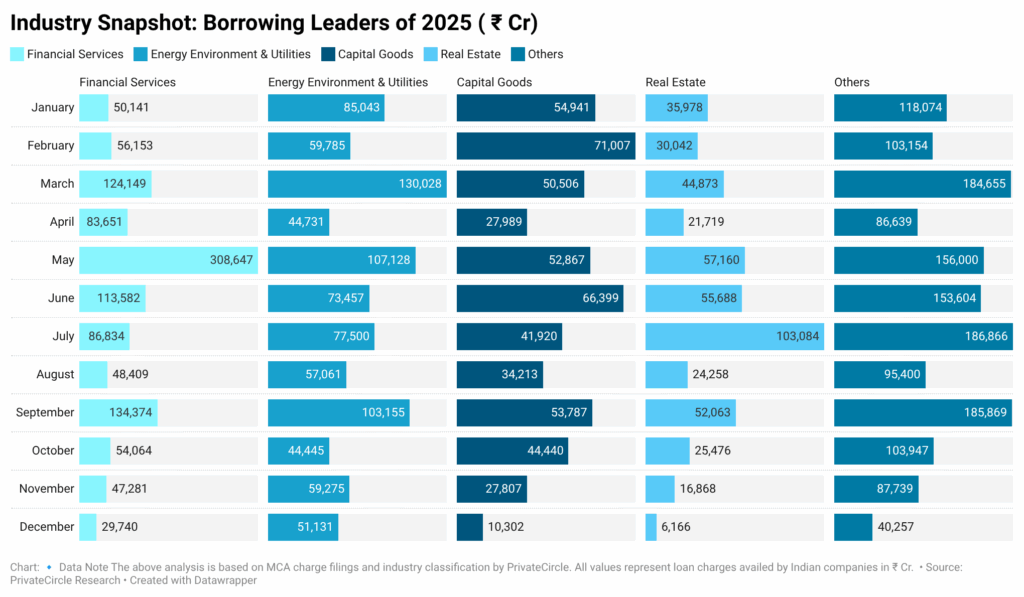
Across the year, five major industry clusters dominated corporate borrowing:
- Financial Services emerged as the single largest borrower, reflecting sustained credit expansion and refinancing activity.
- Energy, Environment & Utilities displayed strong mid-year and year-end momentum, driven by investments in infrastructure and renewable energy.
- Capital Goods borrowing followed a cyclical pattern aligned with capex cycles.
- Real Estate showed selective revival with uneven momentum.
- Others remained consistently large contributors, underlining diversified borrowing across manufacturing, services, and infrastructure sub-sectors.
Month-on-Month Highlights by Industry
🔹 Financial Services
Borrowing accelerated sharply in March and May, with May emerging as the annual peak. This reflects aggressive balance-sheet growth and seasonal refinancing. A gradual slowdown was visible toward the final quarter, signalling tighter credit conditions and moderation in loan growth.
Key Insight: Financial institutions remained the backbone of corporate borrowing, accounting for the highest monthly peaks across the year.
🔹 Energy, Environment & Utilities
Energy and utilities displayed strong spikes in March, September, and December, mirroring capex cycles in power, transmission, and renewables. The steady second-half momentum reflects India’s sustained infrastructure push and green energy transition.
Key Insight: Borrowing in this sector remained structurally strong, with year-end funding supporting long-gestation projects.
🔹 Capital Goods
Capital goods borrowing peaked in February and June, aligning with execution phases of industrial and infrastructure projects. A visible decline in the final quarter suggests project completion cycles and cautious year-end leverage.
Key Insight: Borrowing followed execution-linked capex rhythms rather than continuous expansion.
🔹 Real Estate
Real estate borrowing remained uneven and selective, with visible spikes in May and July but a consistent decline toward year-end. This reflects disciplined leverage, selective project funding, and cautious developer balance sheets.
Key Insight: Despite recovery, real estate borrowing stayed controlled, indicating focus on asset monetisation and cash-flow stability.
🔹 Others
The “Others” category consistently contributed the largest diversified borrowing volumes, peaking in March, July, and September. This category captures manufacturing, logistics, infrastructure SPVs, and services companies tapping structured debt.
Key Insight: Borrowing diversification increased, reducing over-dependence on any single sector.
What the Pattern Tells
Several structural signals emerge from the 2025 borrowing data:
- Financial Services remained the credit engine of India Inc, driving system-wide leverage cycles.
- Infrastructure-linked sectors (Energy & Capital Goods) continued to attract long-term funding, supporting India’s capex-led growth narrative.
- Real estate borrowing stayed disciplined, reflecting a healthier post-cycle balance-sheet strategy.
- Borrowing diversification increased, reducing concentration risk across industries.
- Year-end deleveraging trend indicates improved cash flows and tighter credit discipline.
Why This Matters for Investors & Lenders
- Helps identify sectoral credit appetite and funding momentum.
- Signals capex cycles and expansion phases across industries.
- Highlights risk concentration and leverage trends for banks, NBFCs, and bond investors.
- Acts as an early indicator of economic acceleration or slowdown.
Conclusion
India Inc’s borrowing landscape in 2025 reflected a capex-driven, infrastructure-supported, and financially disciplined cycle. Financial services and infrastructure sectors dominated leverage, while real estate and capital goods followed selective, execution-linked borrowing strategies. The visible year-end moderation suggests an improvement in balance-sheet strength and cautious credit positioning entering 2026.
As corporate India continues its growth and infrastructure expansion journey, loan charge filings remain a powerful lens to track real-time financial momentum across sectors.
Follow PrivateCircle for more data-driven insights on India Inc, corporate borrowings, funding trends, and IPO analytics.