With the world’s highest Fintech adoption rate at 87%, India stands substantially higher than the worldwide average of 64%. The adoption has gained traction by a favorable demographic dividend, digitalization, data ecosystem, adaptable public infrastructure, and ongoing technology innovation.
Indian Fintech industry highlights
- 2,000+ DPIIT (Department for Promotion of Industry and Internal Trade) recognized fintech startups in 2022.
- 23 fintech Unicorns as of July 2022.
- The market size of $50 Bn in 2021.
- Received funding of $8.53 Bn (from 278 deals) in FY22.
- 23 bn digital payments worth ₹ 38.3 lakh crore in Q3, 2022.
- As of September 2022, India’s Unified Payments Interface (UPI) has seen the participation of 358 banks and has recorded ~6.8 Bn transactions worth over $135 Bn.
- Market size is estimated to increase up to ~$150 Bn by 2025.
We examined the fintech deals during Q4 2021 – Q3 2022 and present here a compilation of our findings with visualization. Measured criteria are company stages, investor types, sub-sectors, locations, mega deals, loan costs, and company growth in two years.

Each slide is clickable, providing access to an interactive and downloadable Datawrapper visualization. Let’s deep dive into the fintech deals starting with;
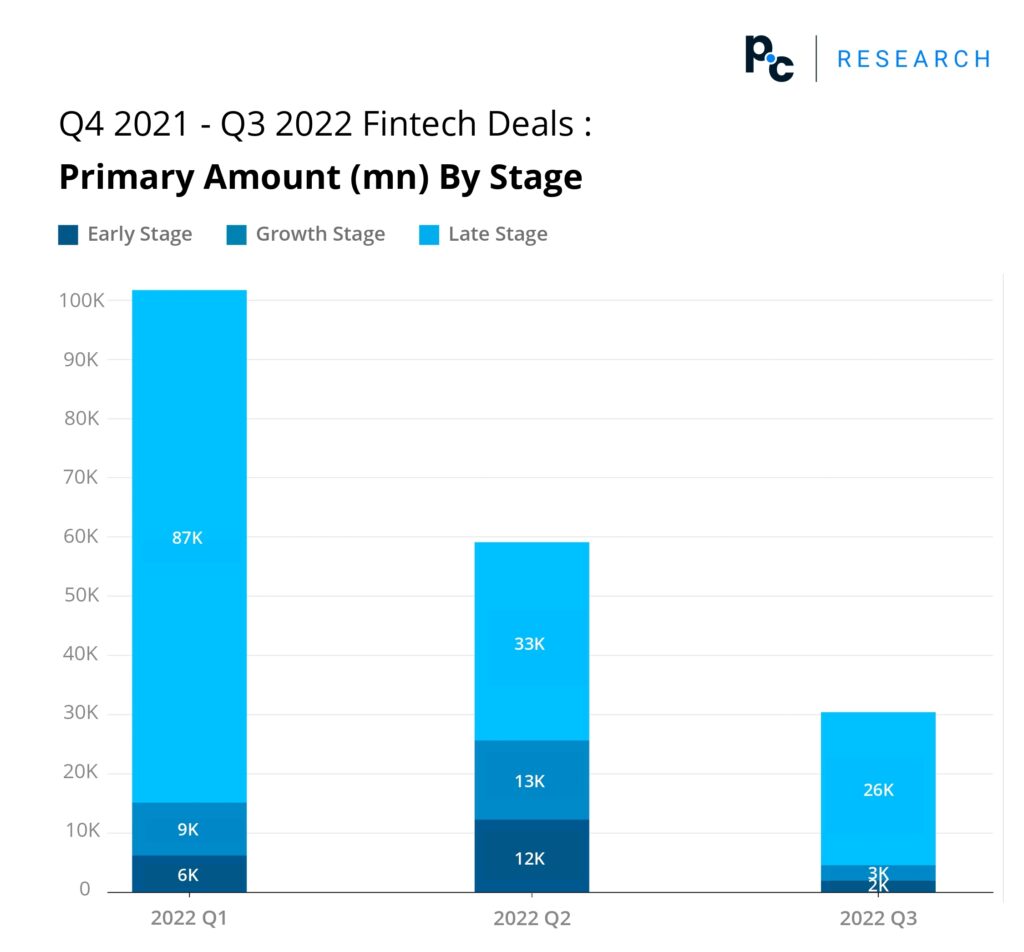
Here, overall we see deal values have fallen in the last 3 quarters. Late-stage companies’ deal value has fallen secularly, while early and growth-stage companies had a positive blip in the last quarter. But if we look at the current quarter even early/growth stage deal values have fallen.
Late stage companies are raising money through debt additionally during the period (refer to figure 6)
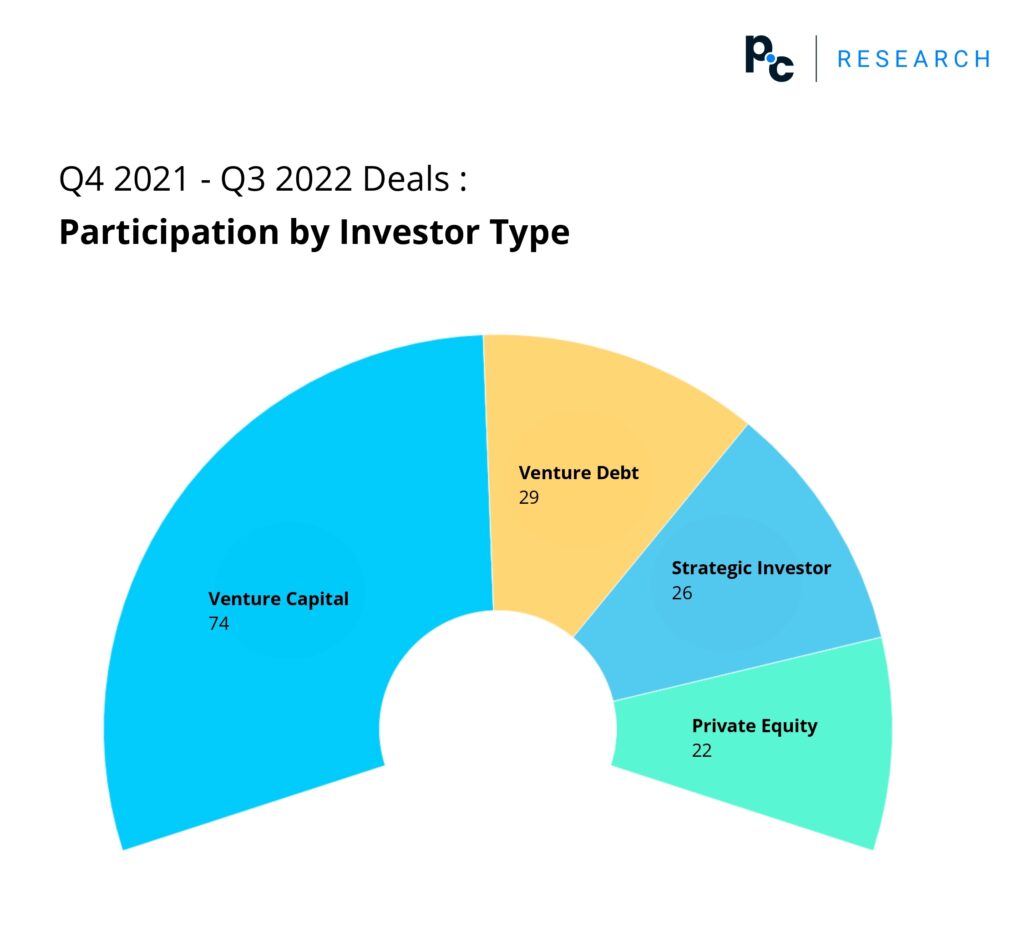
Venture debt (VD) as an investor category is interesting. VD provides debt to VC/PE-funded companies, allowing them to lengthen their runway without further dilution. This seems to be common among fintech companies. We note significant strategic investor interest in companies including Ezetap, Upstox, EarlySalary, Amazon Pay, and Money View among others.
Highest volume from venture capital, followed by venture debt, strategic investor, private equity investors driving innovation in the sector.
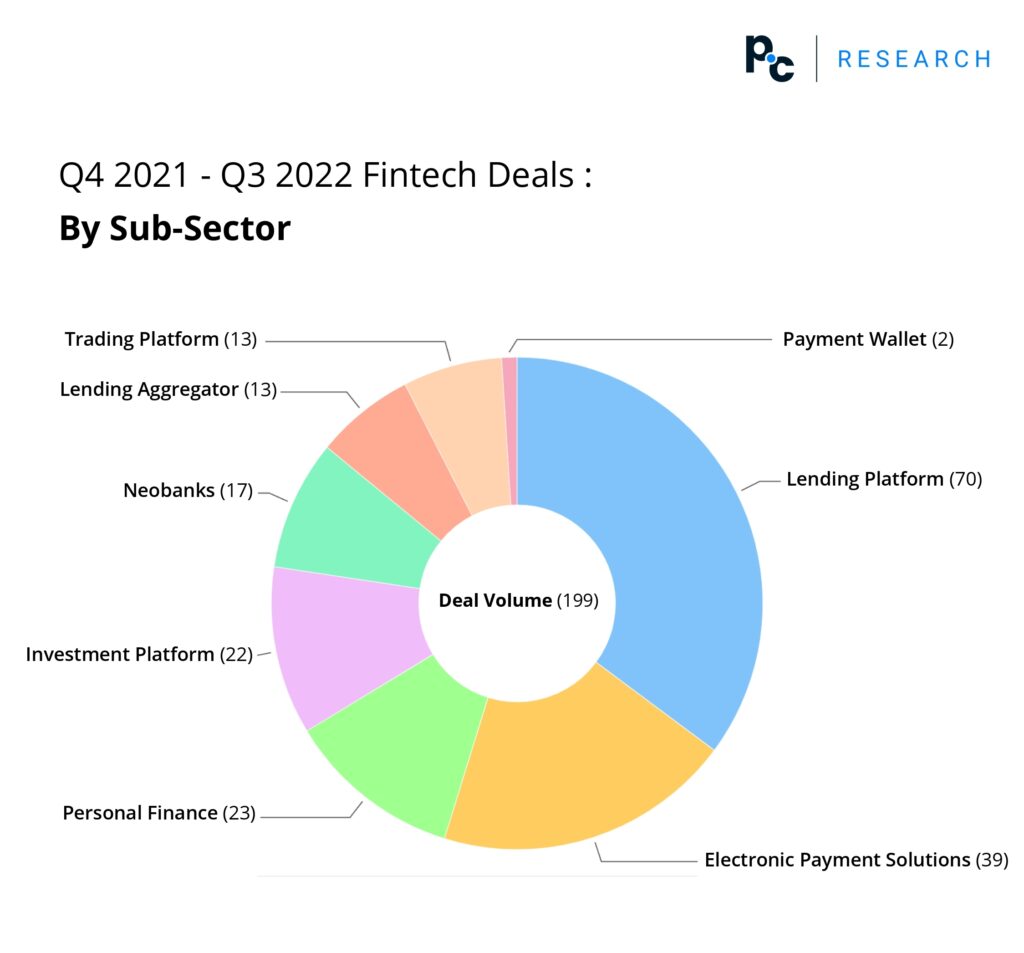
The majority portion of the total 199 deals has been in the lending platform. Followed by electronic payment solutions, personal finance, investment platform, neobanks, with lending aggregators and trading platforms at equal volume.
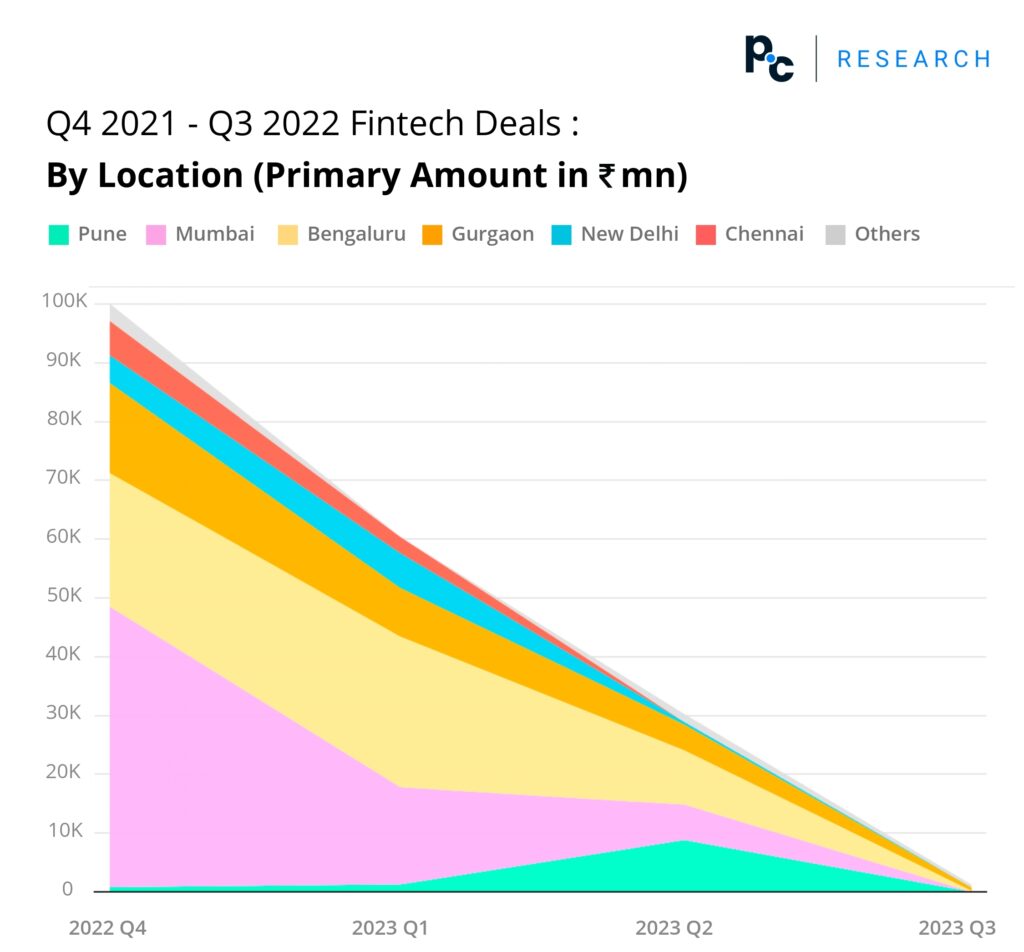
Correction in the X axis labels are as follows, 2021 Q4, 2022 Q1, 2022 Q2, & 2022 Q3.
We see that it has become difficult to raise money in fintech across all the locations. Pune as an exception had a slight blip in Q2. Last quarter has been particularly difficult, with some bouncing back.
Correction in the X axis labels are as follows, 2021 Q4 & 2022 Q1.
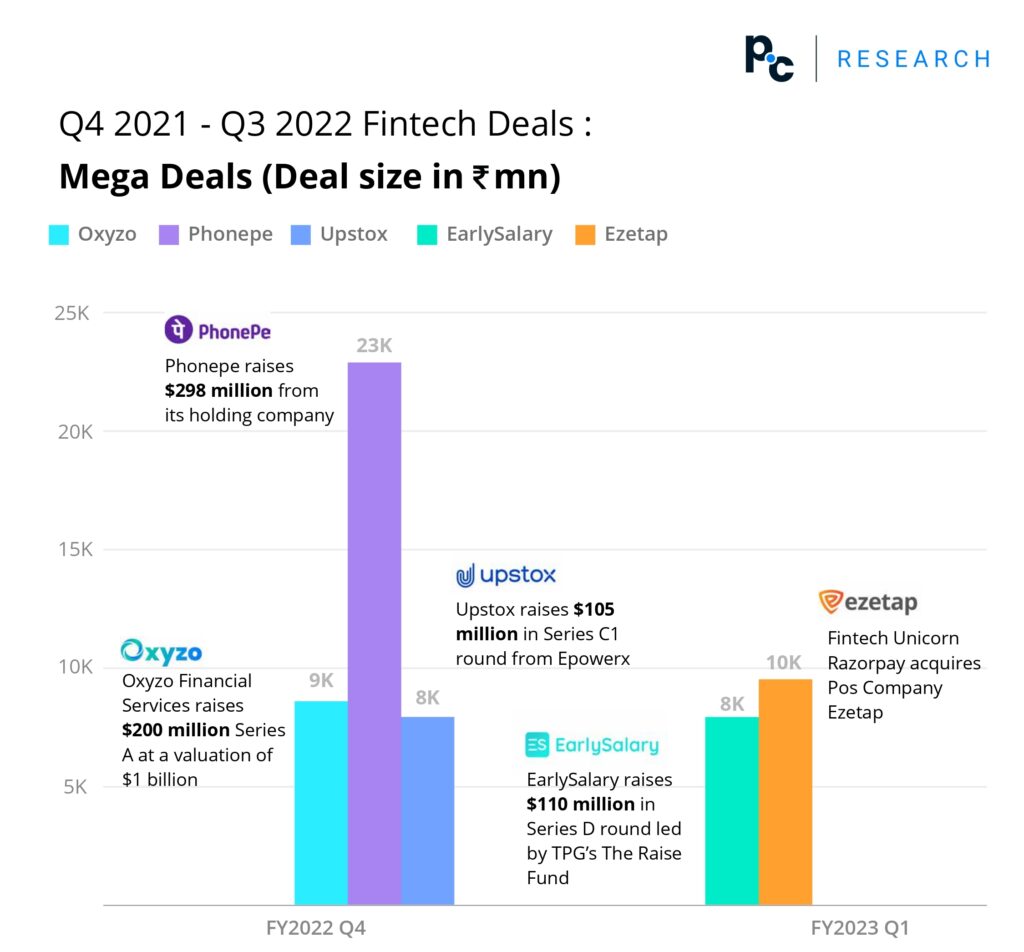
The largest deal in the past year was in PhonePe, where the holding company further pumped in money. Oxyzo gets to its Series A at unicorn valuation with a high number of loans in recent quarter.
Running fintech companies in India at scale has become an expensive affair. Ezetap is an interesting case, from having a mega deal in Dec ’21 (₹ 225 mn) to being acquired within a year. We need to keep a watch on other consolidations that may happen in this sector.
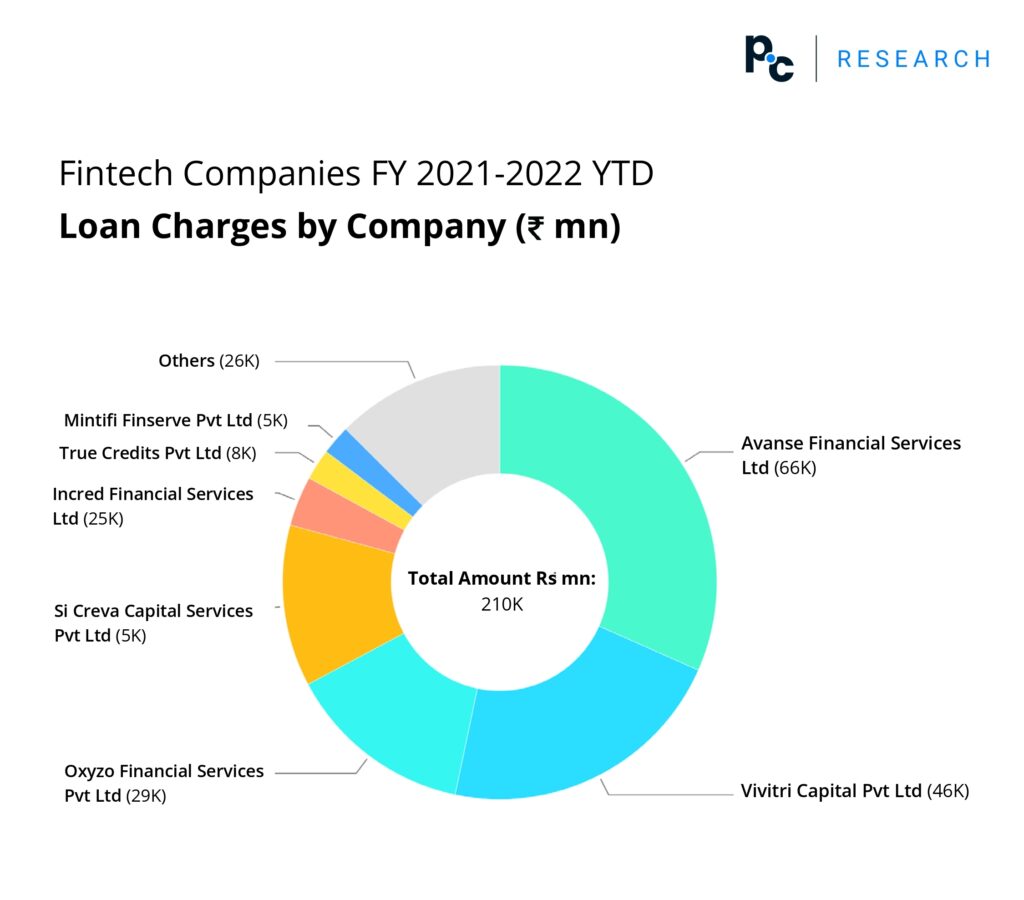
The chart above indicates venture debt follows venture capital as a popular investor type. Among VC/PE invested companies, most lending companies have also raised money through debt.
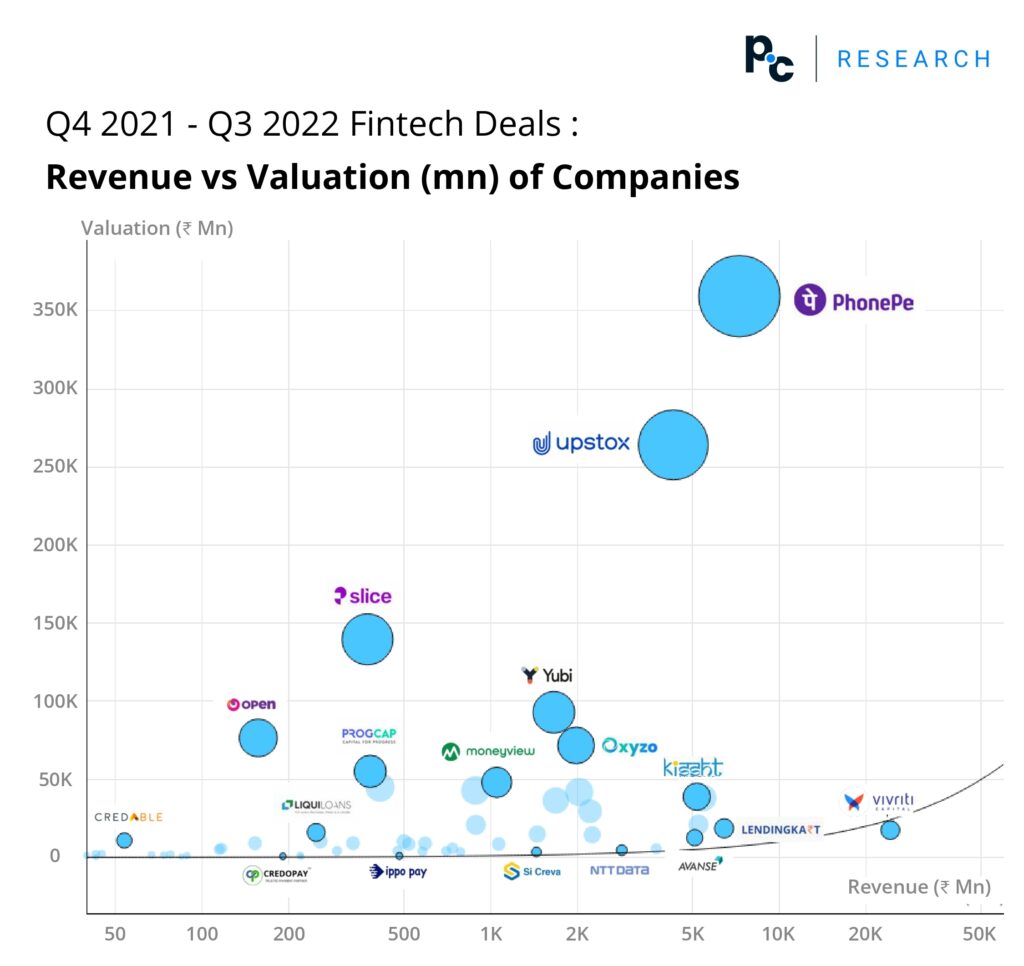
Most are valued in high revenue multiples except Vivriti Capital, which has a large debt in books compared to others. The range of price to revenue multiples varied from < 5 (12 deals) , 5-10 (10 deals), 10-50 (23 deals), > 50 (10 deals).
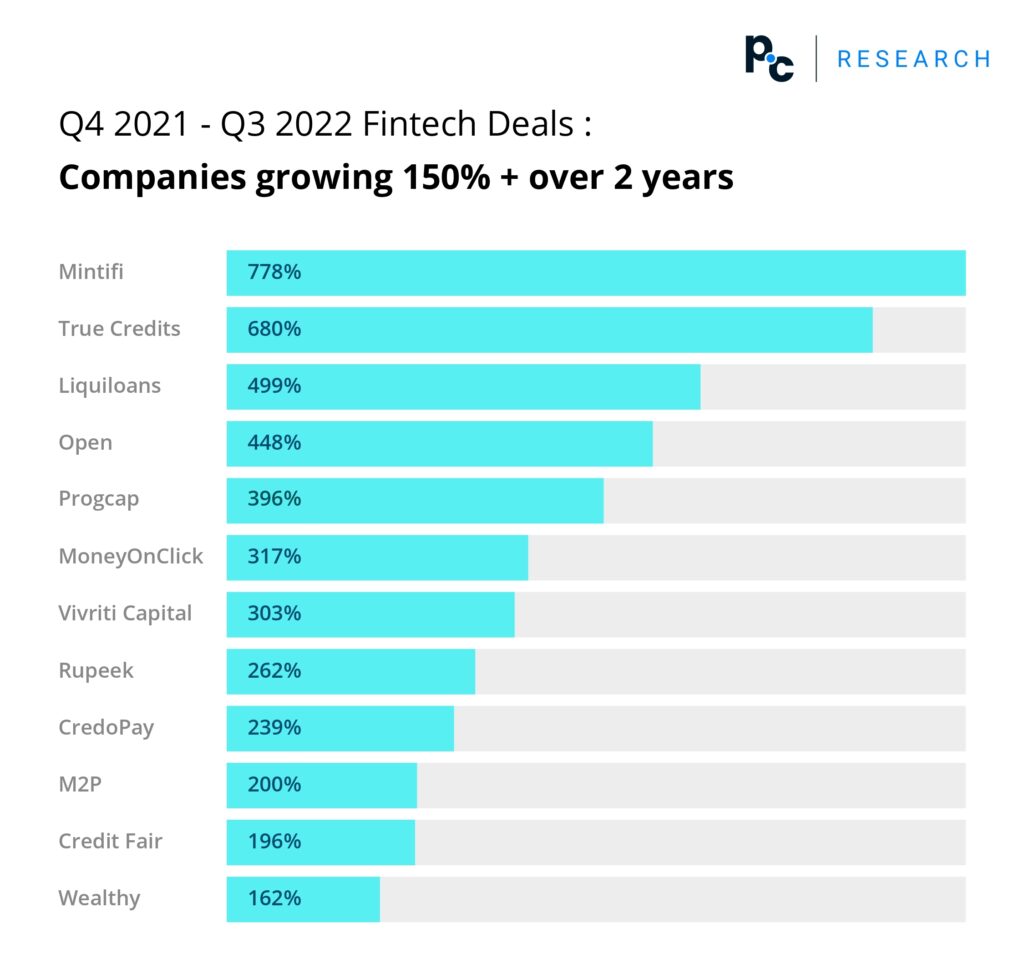
Only those companies that have revenue of ₹ 25Mn or more and a 2-year CAGR of 150+ are considered here. As you see none of the past year mega deals companies have qualified the CAGR base/ filter. So we can say there are more opportunities for an investor in this sector to invest in such companies.
For more industry specific summaries, reports, and everything else you need for business and capital growth, get onboard privatecircle.co.
References
https://www.bain.com/insights/india-fintech-report-2022-sailing-through-turbulent-tides/
https://www.investindia.gov.in/sector/bfsi-fintech-financial-services
