
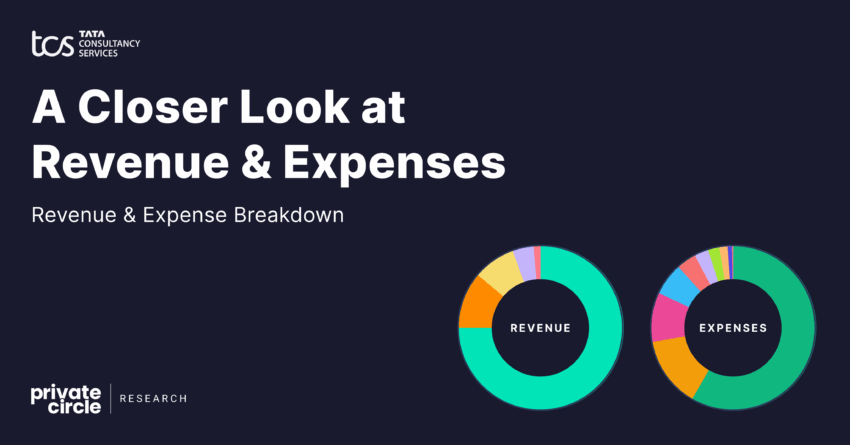
Tata Consultancy Services (TCS) has built a large technology services business with a revenue profile that is strongly driven by consultancy services. At the same time, its expense structure reflects the people-intensive nature of the IT services industry, with employee benefit expenses forming the largest cost.
A closer look at the FY26 numbers provides an interesting view of where TCS generates its revenue and how its expenses are distributed.
Consultancy Services Lead the Revenue Mix
TCS reported total revenue of ₹2,71,423 crore in FY26, with consultancy services accounting for the overwhelming majority of this amount.
Consultancy services contributed ₹2,62,688 crore, making it the company’s primary revenue stream. The remaining revenue came from equipment and software licence sales, interest income, investment-related gains and other income.
TCS Limited: A Closer Look at Revenue & Expenses
Tata Consultancy Services (TCS) has built a large technology services business with a revenue profile that is strongly driven by consultancy services. At the same time, its expense structure reflects the people-intensive nature of the IT services industry, with employee benefit expenses forming the largest cost.
A closer look at the FY26 numbers provides an interesting view of where TCS generates its revenue and how its expenses are distributed.
Consultancy Services Lead the Revenue Mix
TCS reported total revenue of ₹2,71,423 crore in FY26, with consultancy services accounting for the overwhelming majority of this amount.
Consultancy services contributed ₹2,62,688 crore, making it the company’s primary revenue stream. The remaining revenue came from equipment and software licence sales, interest income, investment-related gains and other income.
| Revenue Head | FY26 (₹ Cr) |
|---|---|
| Consultancy services | 2,62,688 |
| Sale of equipment and software licences | 4,333 |
| Interest income | 3,854 |
| Net gain on disposal / fair valuation of investments | 368 |
| Other income | 180 |
| Total | 2,71,423 |

The revenue split highlights the importance of TCS’s core technology and consultancy operations. Consultancy services alone contributed more than 96% of the reported revenue, making it the central driver of the company’s top line.
Employee Costs Dominate the Expense Structure
On the expense side, TCS reported total expenses of ₹2,01,410 crore in FY26.
The largest expense was employee benefit expenses at ₹1,54,994 crore. This reflects the significant role of human capital in delivering technology, consulting and professional services.
Fees paid to external consultants were the second-largest expense at ₹14,699 crore, followed by other expenses at ₹10,612 crore.
| Expense Head | FY26 (₹ Cr) |
|---|---|
| Employee benefit expenses | 1,54,994 |
| Fees to external consultants | 14,699 |
| Other expenses | 10,612 |
| Depreciation & amortisation | 5,560 |
| Cost of equipment & software licences | 4,399 |
| Facility expenses | 3,687 |
| Travel expenses | 3,310 |
| Communication expenses | 2,738 |
| Finance costs | 1,227 |
| Bad debts & related provisions | 184 |
| Total | 2,01,410 |
Employee benefit expenses accounted for roughly 77% of the reported expense base, making workforce costs the most significant component of TCS’s cost structure.
A Closer Look at Other Costs
While employee expenses dominate, TCS also incurs costs across several operational categories.
Fees to external consultants stood at ₹14,699 crore, while depreciation and amortisation amounted to ₹5,560 crore.
The company also reported ₹4,399 crore towards the cost of equipment and software licences. Facility expenses stood at ₹3,687 crore, followed by travel expenses of ₹3,310 crore and communication expenses of ₹2,738 crore.

Finance costs were comparatively smaller at ₹1,227 crore, while bad debts and related provisions stood at ₹184 crore.
This distribution shows that beyond its large employee base, TCS’s cost structure also includes technology, infrastructure, consulting, travel and other operational expenses required to support its global services business.
Revenue vs Expenses
Putting the two sides together, TCS generated ₹2,71,423 crore in revenue against ₹2,01,410 crore in reported expenses during FY26.
The difference between the two provides a starting point for understanding the company’s operating performance, while the individual revenue and expense categories provide greater insight into its business model.
On one side, the revenue base is highly concentrated around consultancy services. On the other, the expense base is heavily concentrated around employee benefits.
What the FY26 Split Tells Us
The FY26 numbers offer a simple but useful view of TCS’s financial structure.
The company continues to generate the vast majority of its revenue from its core consultancy services, while employee-related expenses remain the largest cost associated with delivering those services.
The other expense categories, including external consultants, technology licences, depreciation, facilities, travel and communication, provide additional context on the costs involved in operating at TCS’s scale.
Overall, the revenue and expense split highlights two key features of the business: a highly concentrated core revenue stream and a workforce-led cost structure.
Tracking how these components change over time can provide a useful lens into TCS’s operating model, cost management and financial performance.
PrivateCircle helps businesses and investors go beyond surface-level numbers with structured company intelligence, financial analysis, and data-driven insights.
The revenue split highlights the importance of TCS’s core technology and consultancy operations. Consultancy services alone contributed more than 96% of the reported revenue, making it the central driver of the company’s top line.
Employee Costs Dominate the Expense Structure
On the expense side, TCS reported total expenses of ₹2,01,410 crore in FY26.
The largest expense was employee benefit expenses at ₹1,54,994 crore. This reflects the significant role of human capital in delivering technology, consulting and professional services.
Fees paid to external consultants were the second-largest expense at ₹14,699 crore, followed by other expenses at ₹10,612 crore.
| Expense Head | FY26 (₹ Cr) |
|---|---|
| Employee benefit expenses | 1,54,994 |
| Fees to external consultants | 14,699 |
| Other expenses | 10,612 |
| Depreciation & amortisation | 5,560 |
| Cost of equipment & software licences | 4,399 |
| Facility expenses | 3,687 |
| Travel expenses | 3,310 |
| Communication expenses | 2,738 |
| Finance costs | 1,227 |
| Bad debts & related provisions | 184 |
| Total | 2,01,410 |
Employee benefit expenses accounted for roughly 77% of the reported expense base, making workforce costs the most significant component of TCS’s cost structure.
A Closer Look at Other Costs
While employee expenses dominate, TCS also incurs costs across several operational categories.
Fees to external consultants stood at ₹14,699 crore, while depreciation and amortisation amounted to ₹5,560 crore.
The company also reported ₹4,399 crore towards the cost of equipment and software licences. Facility expenses stood at ₹3,687 crore, followed by travel expenses of ₹3,310 crore and communication expenses of ₹2,738 crore.
Finance costs were comparatively smaller at ₹1,227 crore, while bad debts and related provisions stood at ₹184 crore.
This distribution shows that beyond its large employee base, TCS’s cost structure also includes technology, infrastructure, consulting, travel and other operational expenses required to support its global services business.
Revenue vs Expenses
Putting the two sides together, TCS generated ₹2,71,423 crore in revenue against ₹2,01,410 crore in reported expenses during FY26.
The difference between the two provides a starting point for understanding the company’s operating performance, while the individual revenue and expense categories provide greater insight into its business model.
What the FY26 Split Tells Us
The FY26 numbers offer a simple but useful view of TCS’s financial structure.
The company continues to generate the vast majority of its revenue from its core consultancy services, while employee-related expenses remain the largest cost associated with delivering those services.
The other expense categories, including external consultants, technology licences, depreciation, facilities, travel and communication, provide additional context on the costs involved in operating at TCS’s scale.
Overall, the revenue and expense split highlights two key features of the business: a highly concentrated core revenue stream and a workforce-led cost structure.
Tracking how these components change over time can provide a useful lens into TCS’s operating model, cost management and financial performance.
PrivateCircle helps businesses and investors go beyond surface-level numbers with structured company intelligence, financial analysis, and data-driven insights.