April 2025 saw Indian startups attract robust investor interest, signaling a vibrant start to FY26.
The month recorded a significant uptick in both deal volume and deal value, highlighting growing confidence among investors.
Bangalore startups raised the highest cumulative funding in April 2025 reaching ₹ 4485 cr (27 deals).
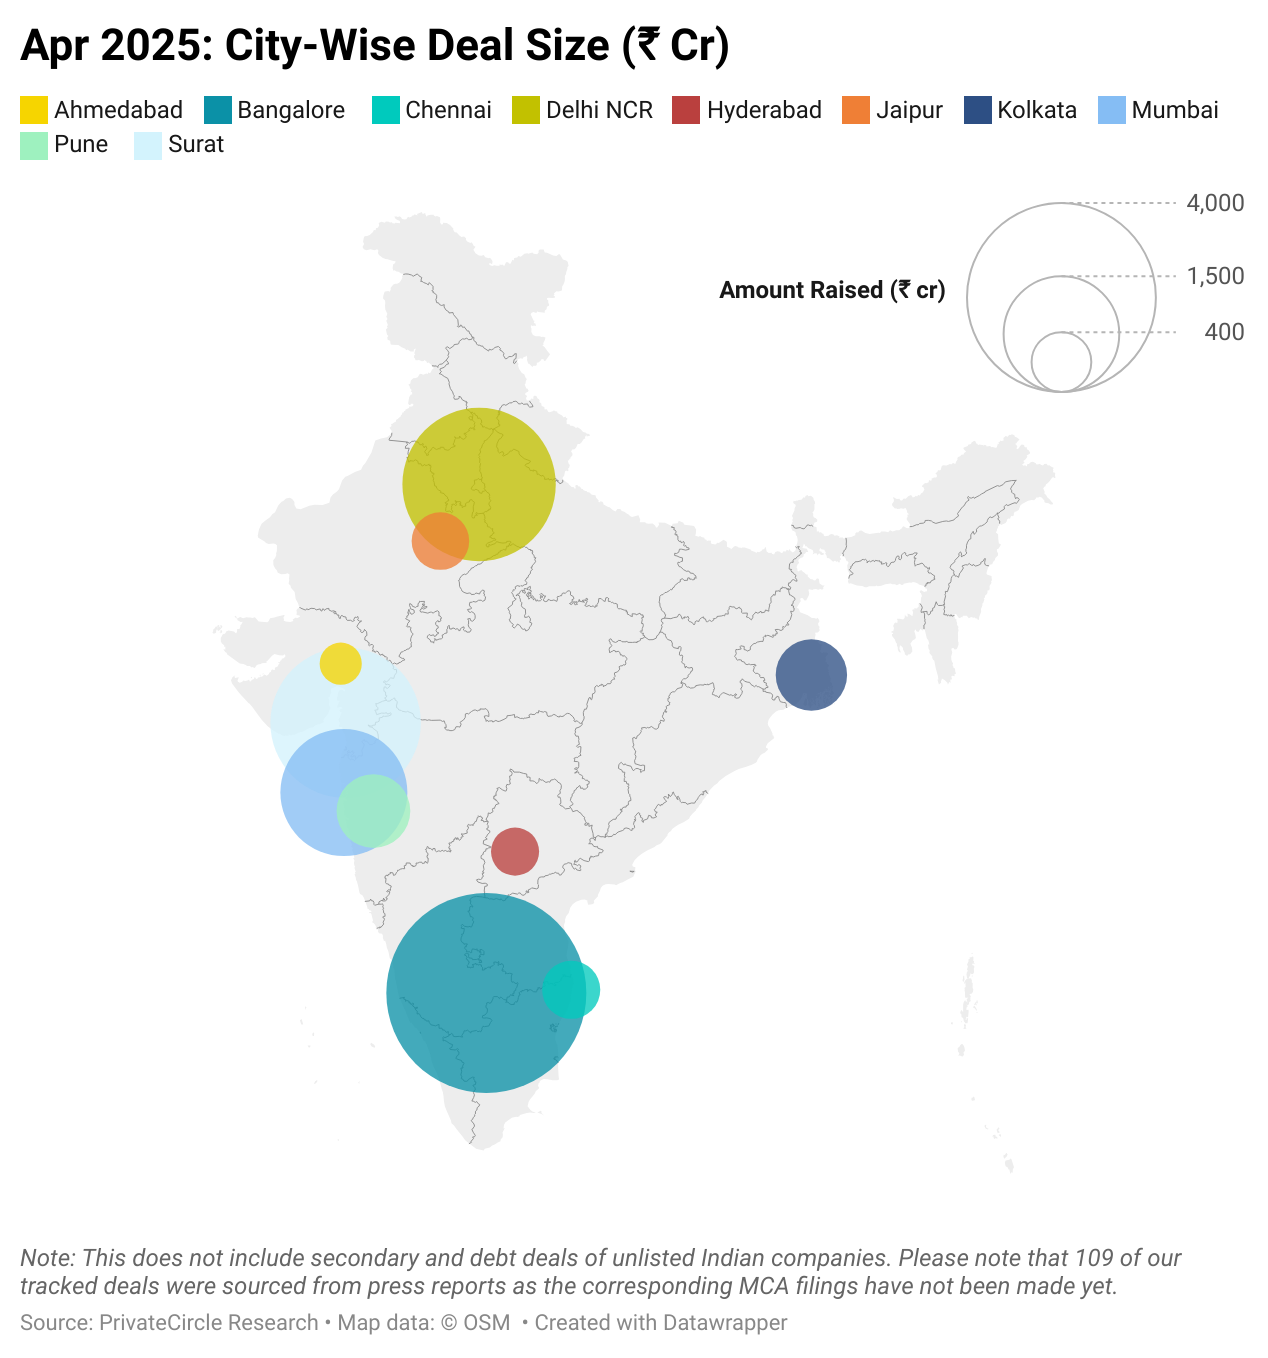
This was followed by Delhi NCR startups at ₹2604 cr (32 deals) and Surat at ₹ 2506 cr (3 deals).
| City | No. of deals | Amount Raised (₹ cr) |
| Bangalore | 27 | 4485 |
| Delhi NCR | 32 | 2604 |
| Surat | 3 | 2506 |
| Mumbai | 25 | 1766 |
| Pune | 8 | 568 |
| Kolkata | 3 | 530 |
| Chennai | 7 | 342 |
| Jaipur | 5 | 335 |
| Hyderabad | 4 | 227 |
| Ahmedabad | 3 | 170 |
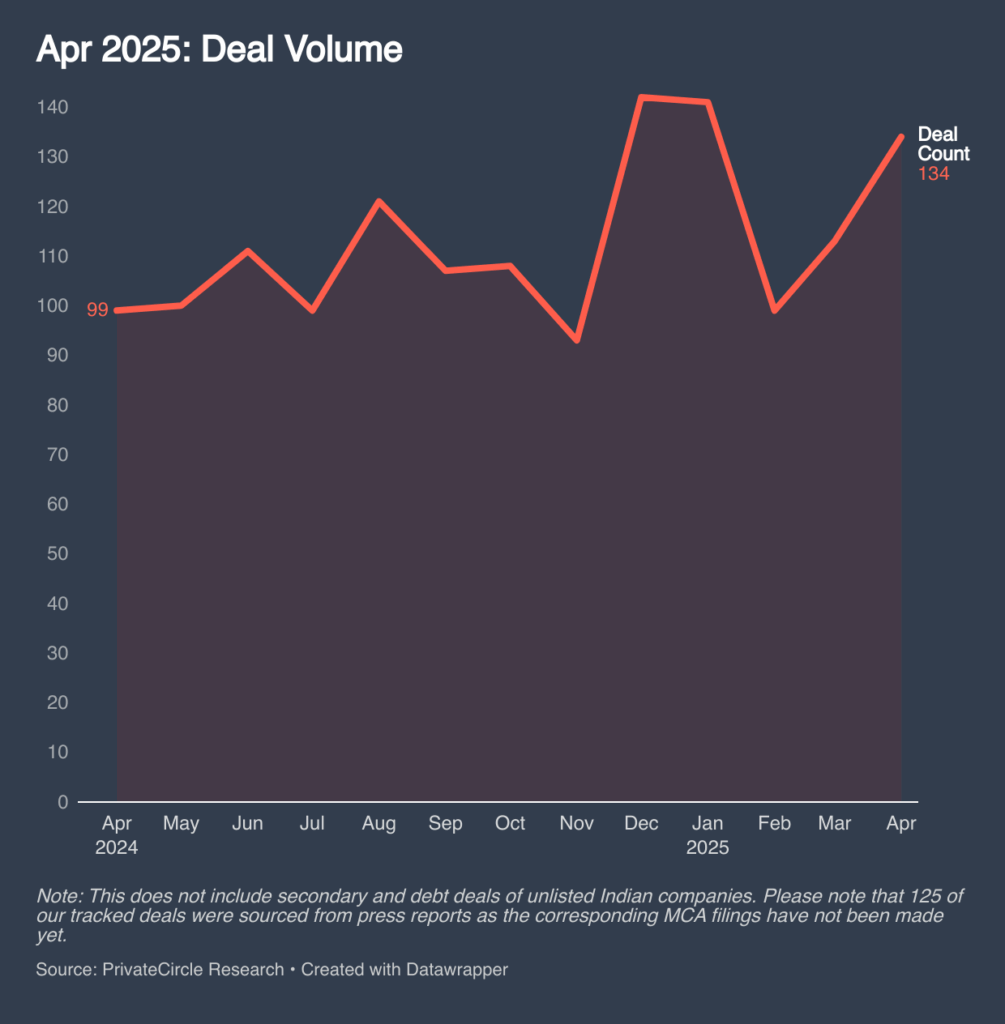
April 2025 recorded 134 private market deals, representing a 13.5% year-over-year increase from 118 deals in April 2024 and an 18.6% rise month-over-month from 113 deals in March 2025.
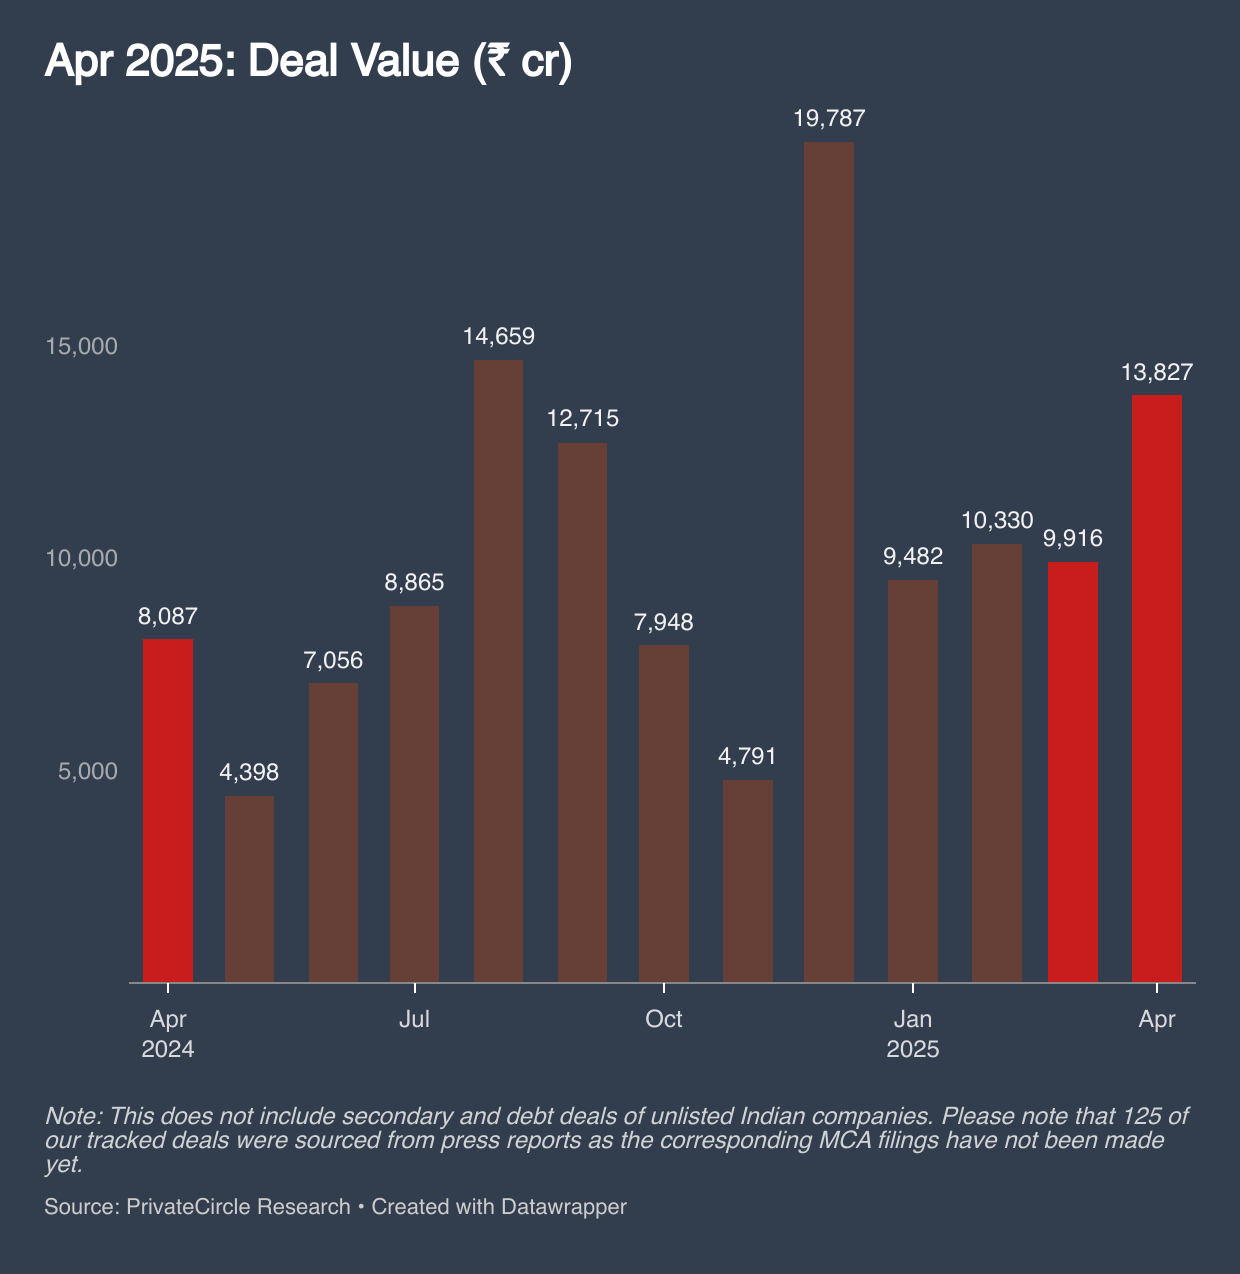
In April 2025, Indian startups raised ₹13,827 crore, marking a 71% increase year-over-year from ₹8,087 crore in April 2024 and a 39.4% rise month-over-month from ₹9,916 crore in March 2025.
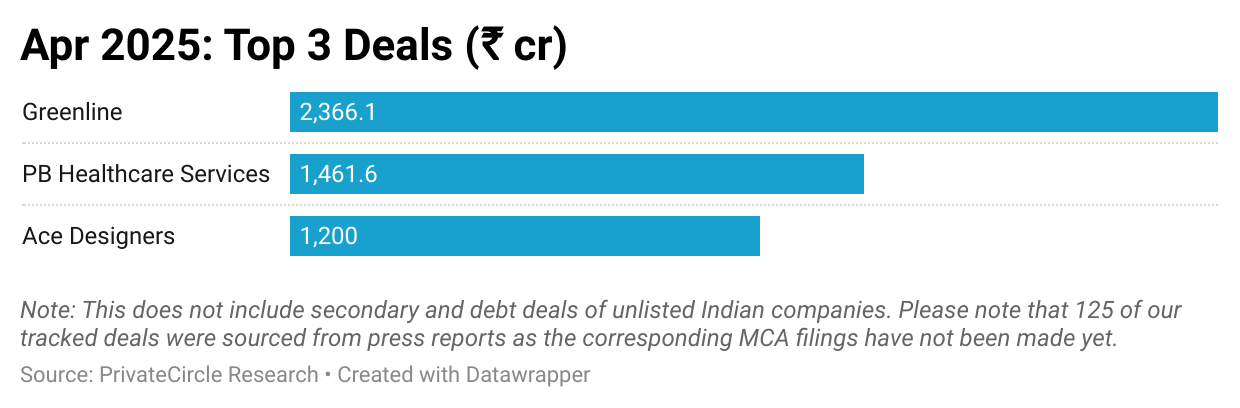
Greenline raised the highest ₹2,366 cr funding, followed by PB Healthcare Services (₹1,462 cr) and Ace Designers (₹1,200 cr).
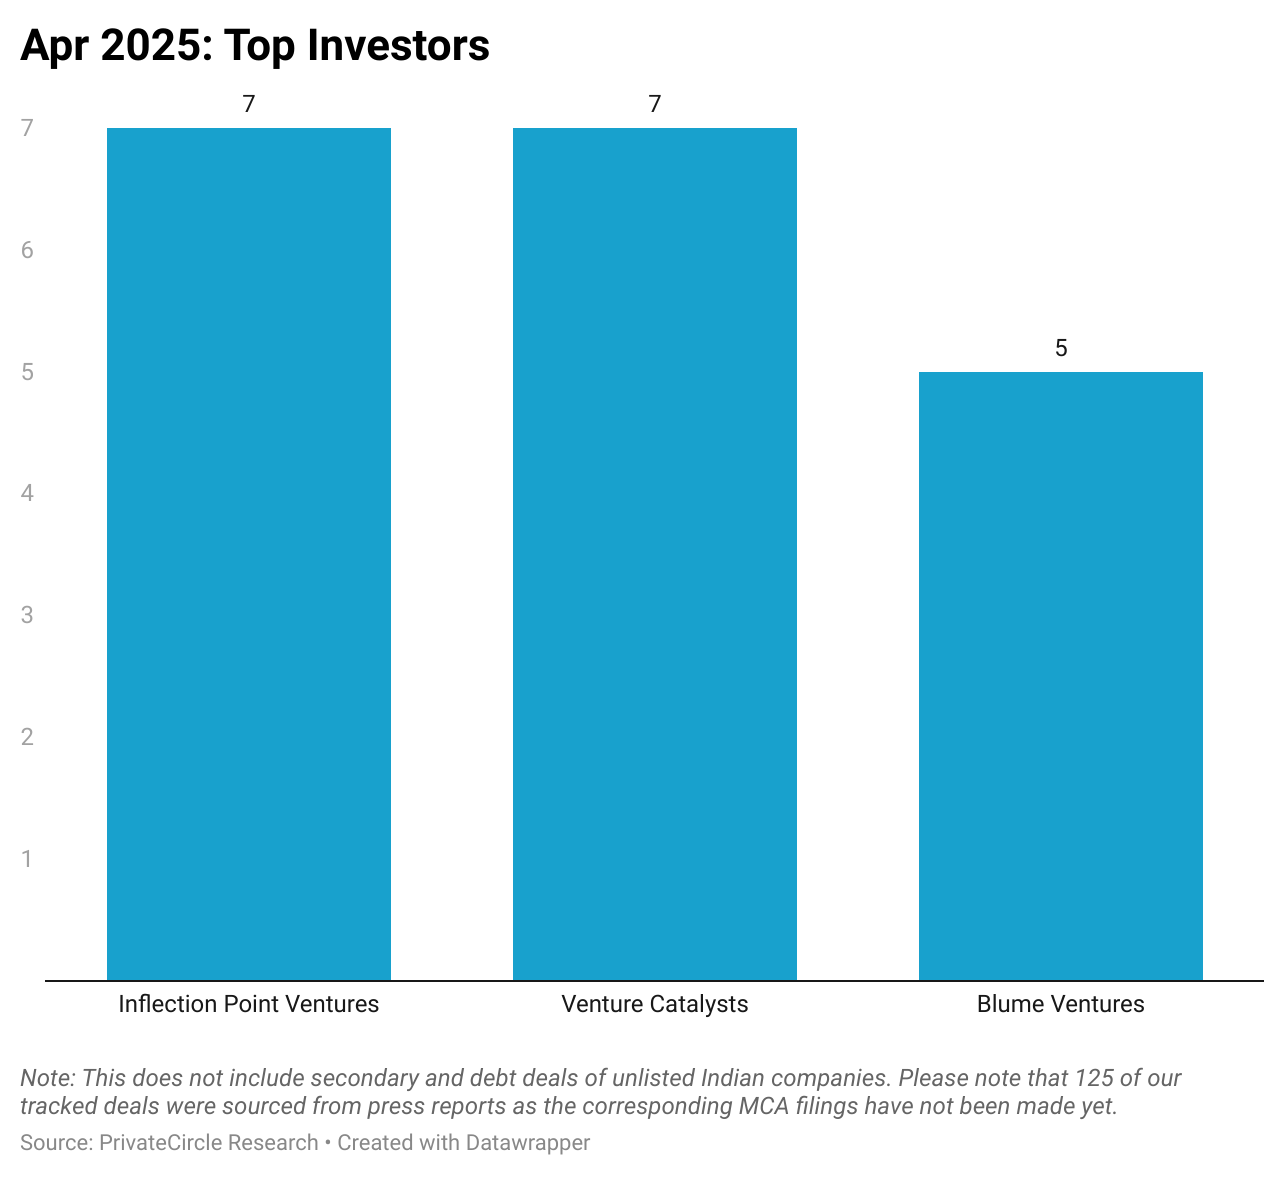
Inflection Point Ventures led the deal activity with 7 investments, while Venture Catalysts and Blume Ventures followed with 7 and 5 deals respectively.
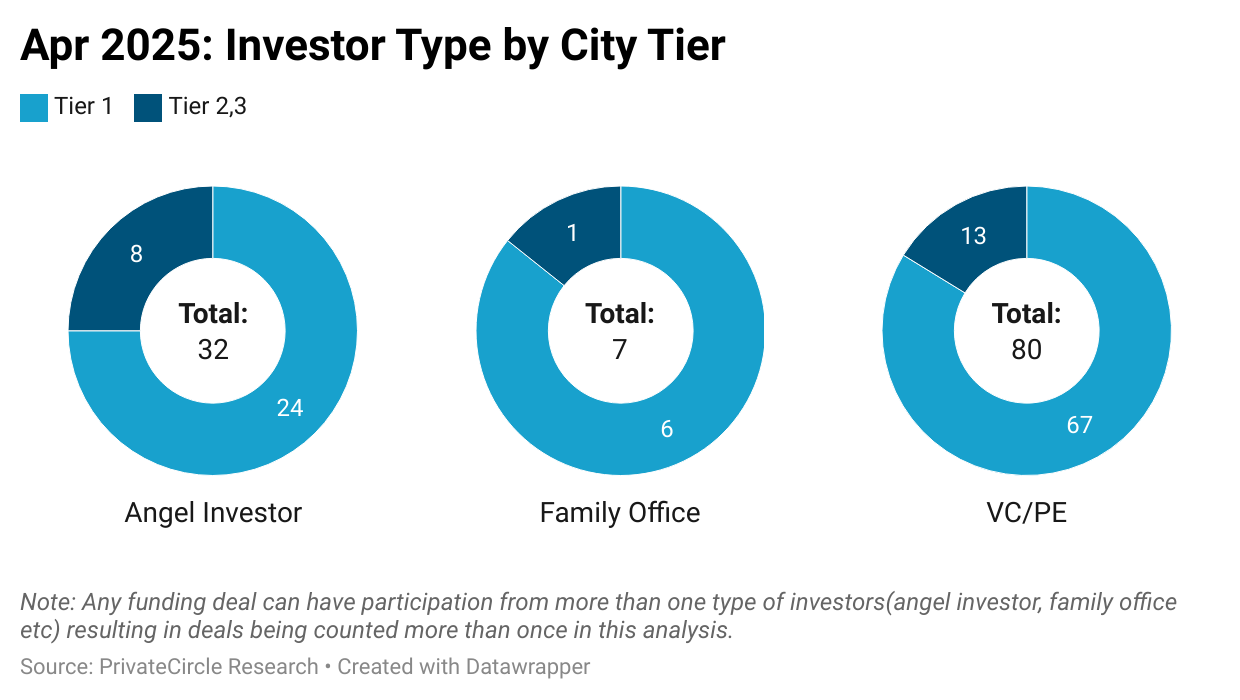
Venture Capital and Private Equity firms drove deal activity in April 2025 with 80 investments, up from 76 in March 2025.
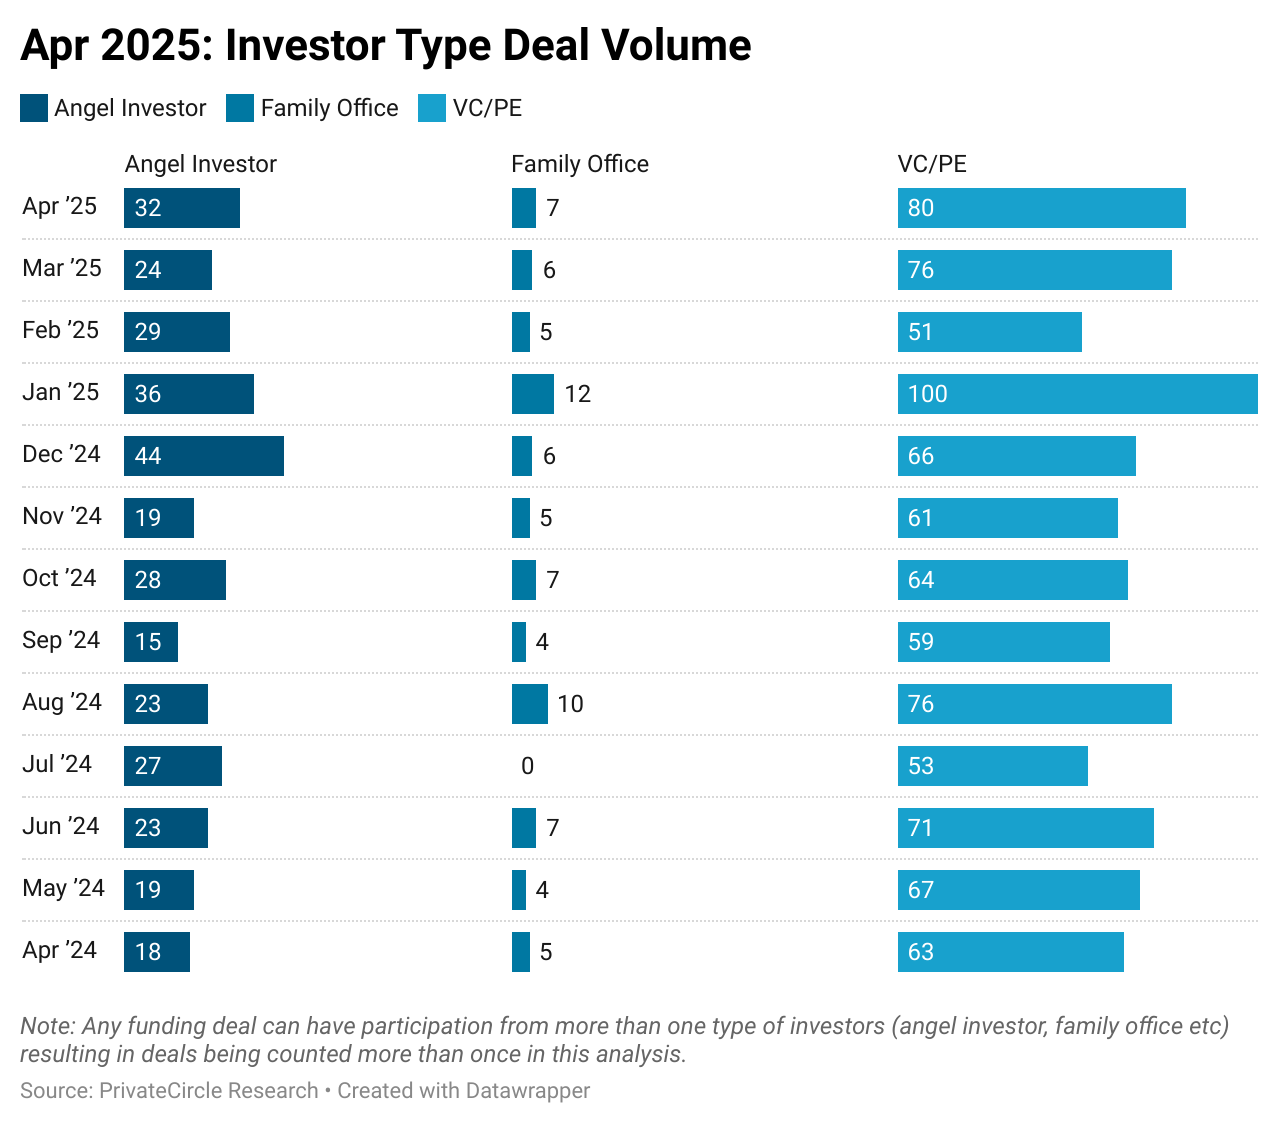
Angel investor participation stood at 32 deals from 24 in the previous month, while family offices saw a slight increase with 7 deals compared to 6 in March 2025.
In April 2025, Tier 1 cities dominated startup funding, raising ₹10,691 crore—nearly 77% of the month’s total capital.
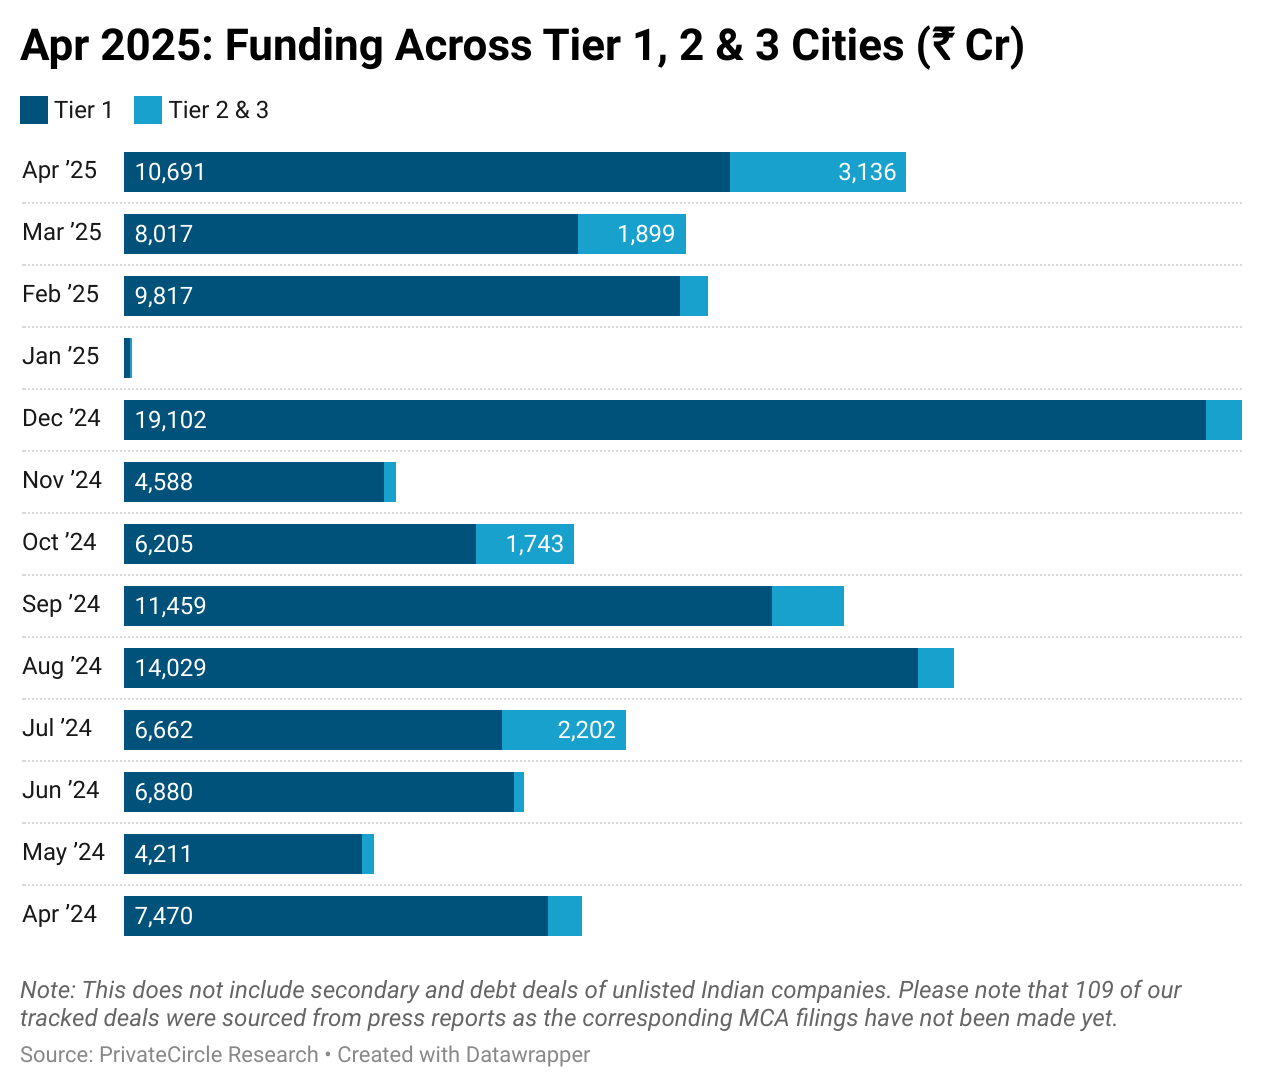
Tier 2 and 3 cities collectively raised ₹3,136 crore, a massive jump from ₹616 crore in April 2024 and ₹1,899 crore in March 2025.
The average deal size in Tier 1 cities was ₹109 crore, while Tier 2 and 3 cities saw a higher average of ₹125 crore.
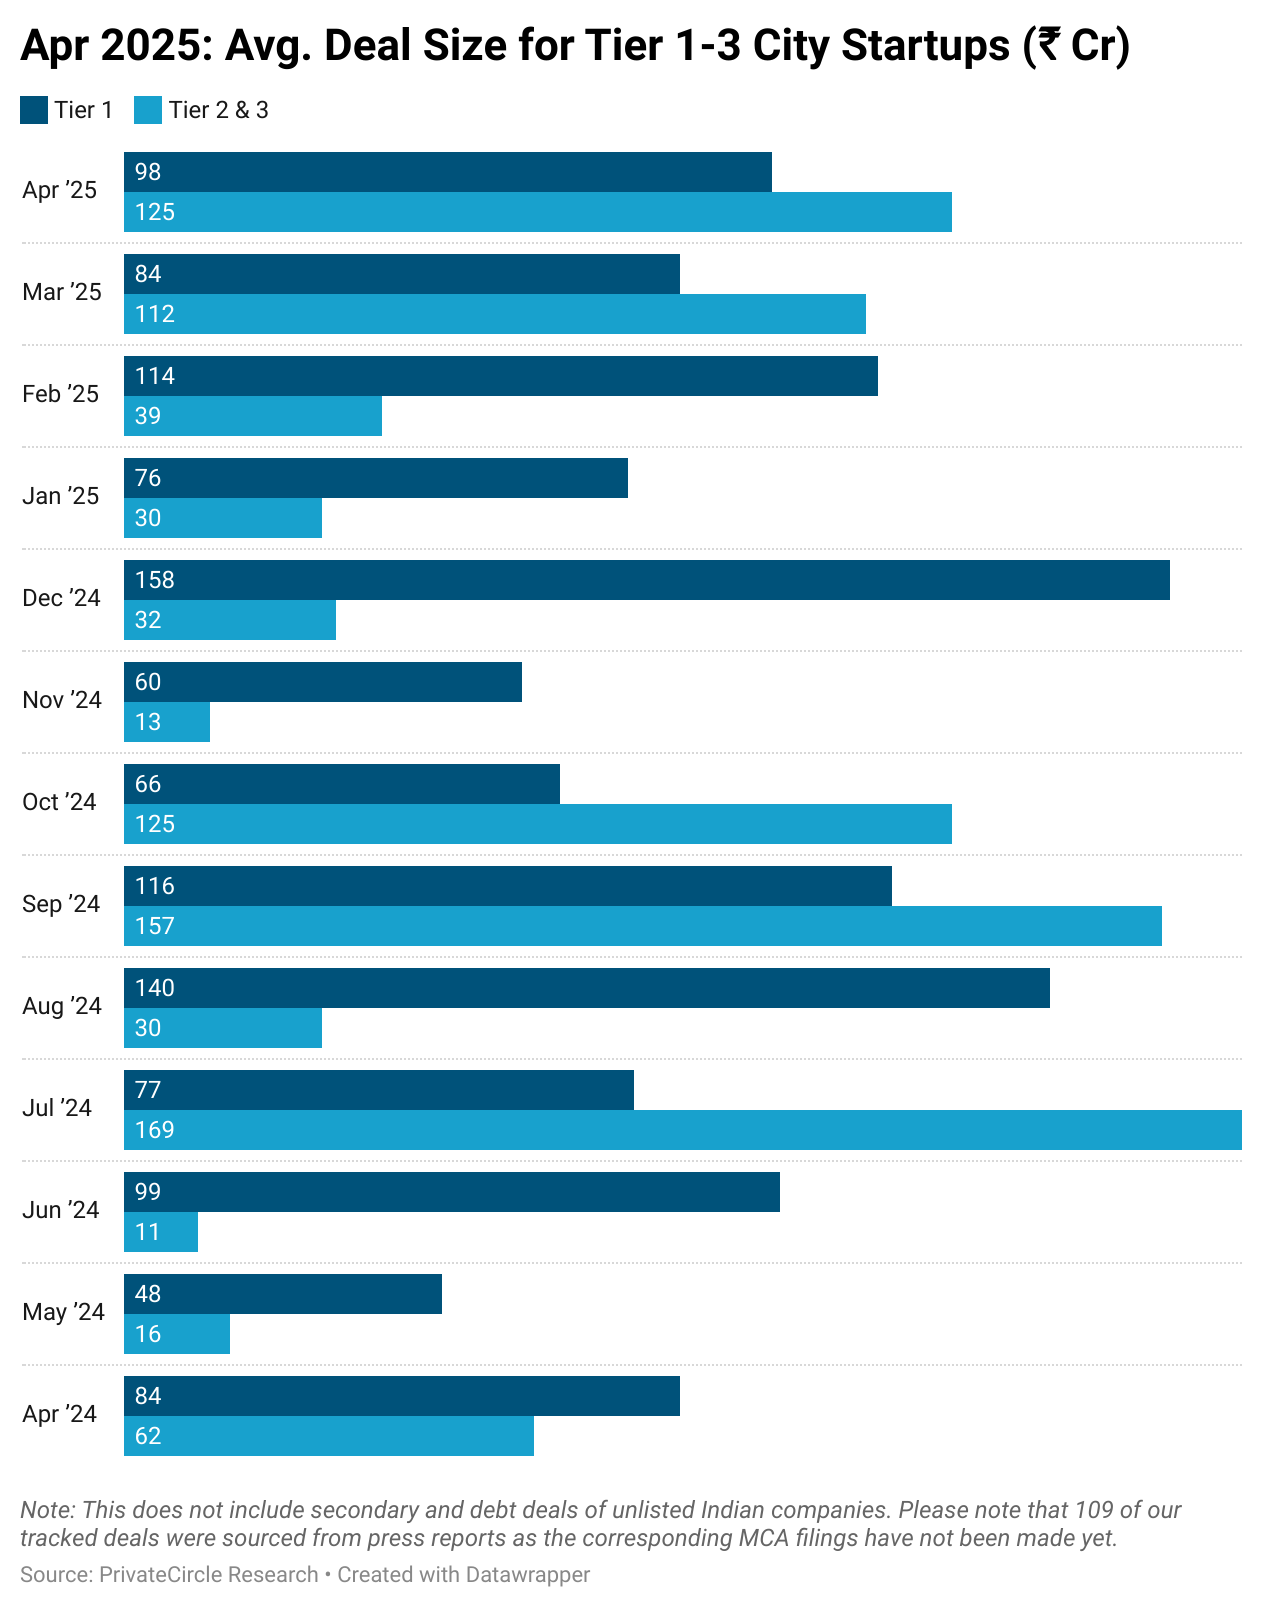
This unusual shift suggests that although Tier 1 cities maintained a strong volume of funding, several large-ticket deals in smaller cities drove up the average, signaling increasing investor confidence in emerging startup ecosystems.
VC/PE closed 67 deals in Tier 1-based companies and 13 in Tier 2,3 companies. Family Offices and Angel Investors were also more active in Tier 1 cities.
This vibrant funding landscape in April underscores robust investor optimism and highlights India’s increasingly diverse and thriving entrepreneurial ecosystem.